
Page 81 - ประสิทธิภาพเชิงเทคนิคของการผลิตข้าวแบบแปลงใหญ่2
P. 81
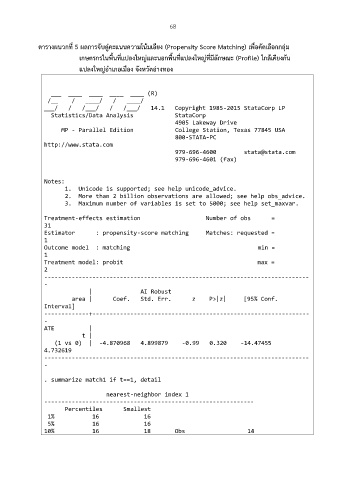
68

              ตารางผนวกที่ 5 ผลการจับคู่คะแนนความโน้มเอียง (Propensity Score Matching) เพื่อคัดเลือกกลุ่ม

                             เกษตรกรในพื้นที่แปลงใหญ่และนอกพื้นที่แปลงใหญที่มลักษณะ (Profile) ใกล้เคียงกัน
                                                                            ี
                                                                         ่
                             แปลงใหญ่อำเภอเมือง จังหวดอ่างทอง
                                                     ั


                   ___  ____  ____  ____  ____ (R)
                  /__    /   ____/   /   ____/
                 ___/   /   /___/   /   /___/   14.1   Copyright 1985-2015 StataCorp LP
                   Statistics/Data Analysis            StataCorp
                                                       4905 Lakeway Drive
                      MP - Parallel Edition            College Station, Texas 77845 USA
                                                       800-STATA-PC
                 http://www.stata.com
                                                       979-696-4600        stata@stata.com
                                                       979-696-4601 (fax)


                 Notes:
                       1.  Unicode is supported; see help unicode_advice.
                       2.  More than 2 billion observations are allowed; see help obs_advice.
                       3.  Maximum number of variables is set to 5000; see help set_maxvar.

                 Treatment-effects estimation                   Number of obs      =
                 31
                 Estimator      : propensity-score matching     Matches: requested =
                 1
                 Outcome model  : matching                                     min =
                 1
                 Treatment model: probit                                       max =
                 2
                 -----------------------------------------------------------------------------
                 -
                              |              AI Robust
                         area |      Coef.   Std. Err.      z    P>|z|     [95% Conf.
                 Interval]
                 -------------+---------------------------------------------------------------
                 -
                 ATE          |
                            t |
                    (1 vs 0)  |  -4.870968   4.899879    -0.99   0.320    -14.47455
                 4.732619
                 -----------------------------------------------------------------------------
                 -

                 . summarize match1 if t==1, detail

                                   nearest-neighbor index 1
                 -------------------------------------------------------------
                       Percentiles      Smallest
                  1%           16             16
                  5%           16             16
                 10%           16             18       Obs                  14