Page 150 - 2018 Comprehensive Annual Financial Report - City of Winston-Salem
P. 150

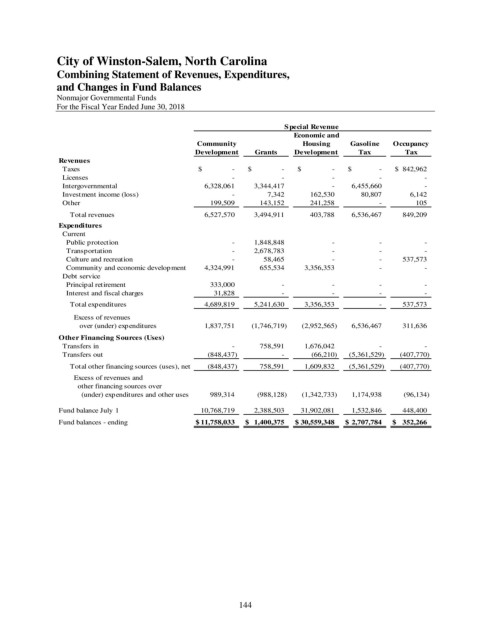
City of Winston-Salem, North Carolina
               Combining Statement of Revenues, Expenditures,
               and Changes in Fund Balances

               Nonmajor Governmental Funds
               For the Fiscal Year Ended June 30, 2018

                                                                          Special Revenue
                                                                            Economic and
                                                   Community                  Housing     Gasoline   Occupancy
                                                   Development    Grants    Development     Tax         Tax
                Revenues
                  Taxes                             $                  -  $                  -  $                  -  $                -  $    842,962
                  Licenses                                              -                      -                      -                    -                   -
                  Intergovernmental                      6,328,061       3,344,417                      -      6,455,660                   -
                  Investment income (loss)                              -              7,342          162,530           80,807            6,142
                  Other                                     199,509          143,152          241,258                    -               105
                      Total revenues                     6,527,570       3,494,911          403,788      6,536,467        849,209
                Expenditures
                  Current
                    Public protection                                   -       1,848,848                      -                    -                   -
                    Transportation                                      -       2,678,783                      -                    -                   -
                    Culture and recreation                              -            58,465                      -                    -        537,573
                    Community and economic development       4,324,991          655,534       3,356,353                    -                   -
                  Debt service
                    Principal retirement                    333,000                      -                      -                    -                   -
                    Interest and fiscal charges               31,828                      -                      -                    -                   -
                      Total expenditures                 4,689,819       5,241,630       3,356,353                    -        537,573
                        Excess of revenues
                           over (under) expenditures       1,837,751      (1,746,719)      (2,952,565)      6,536,467        311,636
                Other Financing Sources (Uses)
                  Transfers in                                          -          758,591       1,676,042                    -                   -
                  Transfers out                            (848,437)                      -           (66,210)    (5,361,529)      (407,770)
                      Total other financing sources (uses), net         (848,437)          758,591       1,609,832    (5,361,529)      (407,770)
                        Excess of revenues and
                          other financing sources over
                            (under) expenditures and other uses          989,314         (988,128)      (1,342,733)      1,174,938        (96,134)

                Fund balance July 1                    10,768,719       2,388,503     31,902,081      1,532,846        448,400
                Fund balances - ending             $  11,758,033  $    1,400,375  $   30,559,348  $   2,707,784  $     352,266


                                                              144
   145   146   147   148   149   150   151   152   153   154   155