
Page 25 - BTSG AR 2021_EN_web_220701_notext_EN
P. 25
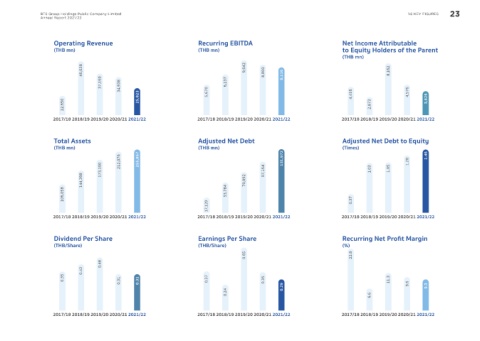
BTS Group Holdings Public Company Limited                                                                                       1.6 KEY FIGURES  23
               Annual Report 2021/22


                    Operating Revenue                                 Recurring EBITDA                                  Net Income Attributable
                    (THB mn)                                          (THB mn)                                          to Equity Holders of the Parent
                                                                                                                        (THB mn)
                              46,028                                                  9,642  8,800   8,116                               8,162

                                    37,169  34,938                       5,670  6,137                                                          4,576


                       12,650                     25,823                                                                    4,416  2,873               3,826


                    2017/18 2018/19  2019/20  2020/21 2021/22         2017/18  2018/19 2019/20  2020/21  2021/22        2017/18  2018/19  2019/20  2020/21 2021/22


                    Total Assets                                      Adjusted Net Debt                                 Adjusted Net Debt to Equity
                    (THB mn)                                          (THB mn)                                          (Times)
                                           212,076   255,867                                         131,972                                   1.28   1.46
                                    173,100                                                  97,164                               1.03   1.05
                              144,398                                                 70,892

                       106,058                                                  53,784

                                                                         17,129                                             0.37

                    2017/18 2018/19  2019/20  2020/21 2021/22         2017/18  2018/19 2019/20  2020/21  2021/22        2017/18  2018/19  2019/20  2020/21 2021/22


                    Dividend Per Share                                Earnings Per Share                                Recurring Net Profit Margin
                    (THB/Share)                                       (THB/Share)                                       (%)
                                                                                      0.65                                  22.8
                                    0.48
                              0.42
                       0.35                0.31  0.31                    0.37                0.35                                        11.3  9.6

                                                                                0.24                0.29                          6.6                 9.3


                   2017/18 2018/19  2019/20  2020/21 2021/22          2017/18  2018/19 2019/20  2020/21  2021/22        2017/18  2018/19  2019/20  2020/21 2021/22