
Page 41 - PBD Plus Sains T4 (EG)
P. 41
Sains Tingkatan 4 Bab 6
Keputusan / Results:
Ketinggian (mm)
Masa (hari) Height (mm)
Time (day) Anak benih 1 Anak benih 2 Anak benih 3 Purata
Sprout 1 Sprout 2 Sprout 3 Average
0 0 0 0 0
1 0 0 0 0
2 9 10 10 9.7
3 42 44 45 43.7
4 65 60 70 65.0
5 80 81 80 80.3
6 101 92 102 98.3
7 119 114 115 116.0
Analisis data / Data analysis:
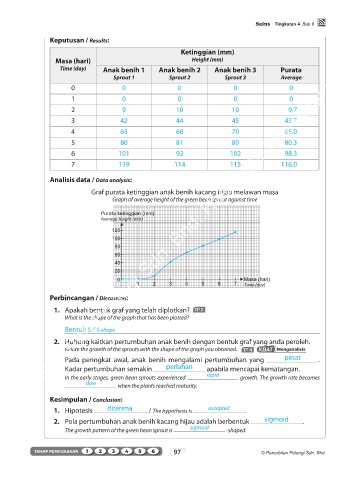
Graf purata ketinggian anak benih kacang hijau melawan masa
Graph of average height of the green bean sprout against time
Purata ketinggian (mm)
Average height (mm)
120
100
80
60
40
20
0 Masa (hari)
1 2 3 4 5 6 7 Time (day)
Perbincangan / Discussion:
1. Apakah bentuk graf yang telah diplotkan? TP 2
What is the shape of the graph that has been plotted?
Bentuk S / S-shape
2. Hubung kaitkan pertumbuhan anak benih dengan bentuk graf yang anda peroleh.
Relate the growth of the sprouts with the shape of the graph you obtained. TP 4 KBAT Menganalisis
Pada peringkat awal, anak benih mengalami pertumbuhan yang pesat .
Kadar pertumbuhan semakin perlahan apabila mencapai kematangan.
In the early stages, green bean sprouts experienced rapid growth. The growth rate becomes
slow when the plants reached maturity.
Kesimpulan / Conclusion:
1. Hipotesis diterima . / The hypothesis is accepted .
2. Pola pertumbuhan anak benih kacang hijau adalah berbentuk sigmoid .
The growth pattern of the green bean sprout is sigmoid -shaped.
TAHAP PENGUASAAN 1 2 3 4 5 6 97 © Penerbitan Pelangi Sdn. Bhd.
06a PBD Plus Sains Bab 6 Tg.4.indd 97 29/12/2022 3:46 PM