Page 20 - ACE YR IGCSE A TOP APPR' TO ADD MATH
P. 20

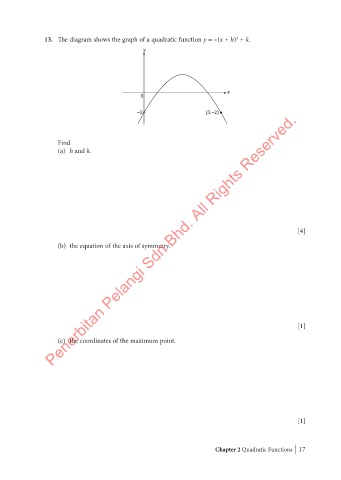
13.  The diagram shows the graph of a quadratic function y = –(x + h)  + k.
                                                                                          2
                                                        y


                                                                                      x
                                                       0


                                                      –2                       (3,–2)
                          (b)  the equation of the axis of symmetry.Bhd. All Rights Reserved.


                          Find
                          (a)  h and k.


                                                                                                                [4]
                        Penerbitan Pelangi Sdn


                                                                                                                [1]


                          (c)  the coordinates of the maximum point.


                                                                                                                [1]


                                                                                  Chapter 2 Quadratic Functions    17


         Chapter 2 Add Math (13 to 21).indd   17                                                                 14/03/2022   12:16 PM
   15   16   17   18   19   20   21   22   23   24   25