
Page 32 - PBD Plus Biologi T5 (EG)
P. 32
Praktis SPM 2
Praktis Ekstra SPM 2
KERTAS 1
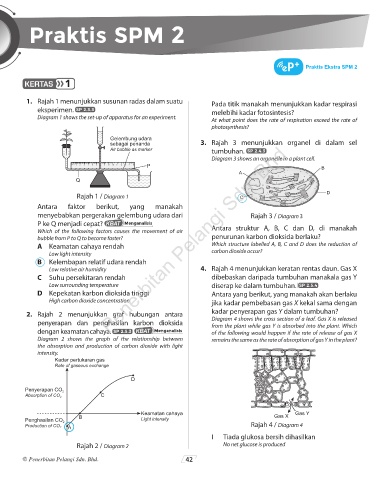
1. Rajah 1 menunjukkan susunan radas dalam suatu Pada titik manakah menunjukkan kadar respirasi
eksperimen. SP 2.3.3 melebihi kadar fotosintesis?
Diagram 1 shows the set-up of apparatus for an experiment. At what point does the rate of respiration exceed the rate of
photosynthesis?
Gelembung udara
sebagai penanda 3. Rajah 3 menunjukkan organel di dalam sel
Penerbitan Pelangi Sdn. Bhd
Air bubble as marker tumbuhan. SP 2.4.3
Diagram 3 shows an organelle in a plant cell.
P B
A
Q
D
Rajah 1 / Diagram 1 C
Antara faktor berikut, yang manakah
menyebabkan pergerakan gelembung udara dari Rajah 3 / Diagram 3
P ke Q menjadi cepat? KBAT Menganalisis
Which of the following factors causes the movement of air Antara struktur A, B, C dan D, di manakah
bubble from P to Q to become faster? penurunan karbon dioksida berlaku?
A Keamatan cahaya rendah Which structure labelled A, B, C and D does the reduction of
Low light intensity carbon dioxide occur?
B Kelembapan relatif udara rendah
Low relative air humidity 4. Rajah 4 menunjukkan keratan rentas daun. Gas X
C Suhu persekitaran rendah dibebaskan daripada tumbuhan manakala gas Y
Low surrounding temperature diserap ke dalam tumbuhan. SP 2.5.4
D Kepekatan karbon dioksida tinggi Antara yang berikut, yang manakah akan berlaku
High carbon dioxide concentration jika kadar pembebasan gas X kekal sama dengan
2. Rajah 2 menunjukkan graf hubungan antara kadar penyerapan gas Y dalam tumbuhan?
Diagram 4 shows the cross section of a leaf. Gas X is released
penyerapan dan penghasilan karbon dioksida from the plant while gas Y is absorbed into the plant. Which
dengan keamatan cahaya. SP 2.5.3 KBAT Menganalisis of the following would happen if the rate of release of gas X
Diagram 2 shows the graph of the relationship between remains the same as the rate of absorption of gas Y in the plant?
the absorption and production of carbon dioxide with light
intensity.
Kadar pertukaran gas
Rate of gaseous exchange
D
Penyerapan CO 2
C
Absorption of CO 2
Keamatan cahaya Gas Y
B Light intensity Gas X
Penghasilan CO 2
Production of CO 2 A Rajah 4 / Diagram 4
I Tiada glukosa bersih dihasilkan
Rajah 2 / Diagram 2 No net glucose is produced
© Penerbitan Pelangi Sdn. Bhd. 42
02 PBD PLUS BIOLOGY TG5.indd 42 25/11/2022 10:14 AM