
Page 150 - The Effect of Hydrogen and Hydrides - ebook first test
P. 150
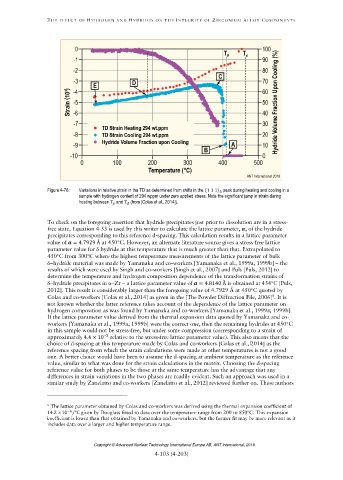
Figure 4-76: Variations in relative strain in the TD as determined from shifts in the (1 1 1) peak during heating and cooling in a
δ
sample with hydrogen content of 294 wppm under zero applied stress. Note the significant jump in strain during
heating between and (from [Colas et al., 2014]).
= 4.7929 Å
α = 4.8140 Å
4.4 × 10 3
14.2 10 −6 /°C
Copyright © Advanced Nuclear Technology International Europe AB, ANT International, 2019.