
Page 234 - The Effect of Hydrogen and Hydrides - ebook first test
P. 234
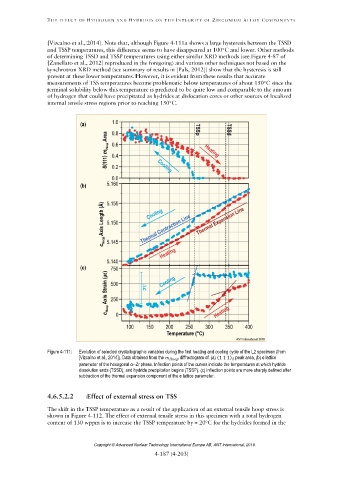
Figure 4-111: Evolution of selected crystallographic variables during the first heating and cooling cycle of the L2 specimen (from
[Vizcaíno et al., 2014]). Data obtained from the diffractogram of: (a) (1 1 1) peak area, (b) c lattice
parameter of the hexagonal αZr phase. Inflection points of the curves indicate the temperatures at which hydride
dissolution ends (TSSD), and hydride precipitation begins (TSSP). (c) Inflection points are more sharply defined after
subtraction of the thermal expansion component of the c lattice parameter.
Copyright © Advanced Nuclear Technology International Europe AB, ANT International, 2019.