
Page 287 - The Effect of Hydrogen and Hydrides - ebook first test
P. 287
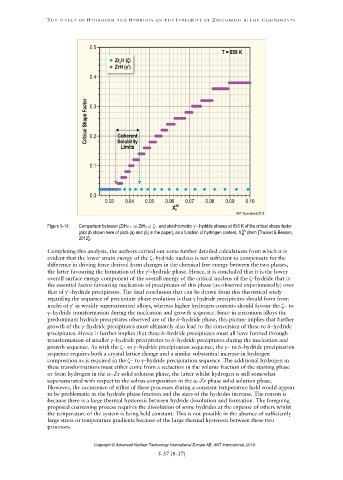
Figure 5-14: Comparison between (ZrH0.3 to ZrH0.4) and stoichiometric hydride phases at 650 K of the critical shape factor
SS
(plot (b shown here of plots (a) and (b) in the paper), as a function of hydrogen content, X (from [Thuinet & Besson,
H
2012]).
Copyright © Advanced Nuclear Technology International Europe AB, ANT International, 2019.