
Page 7 - Comprehensive Needs Assessment Toolbook, By Deb Wahlstrom
P. 7
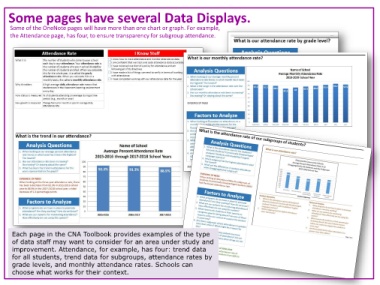
Some pages have several Data Displays.

     Some of the OneNote pages will have more than one chart or graph. For example,
     the Attendance page, has four, to ensure transparency for subgroup attendance.


      Each page in the CNA Toolbook provides examples of the type
      of data staff may want to consider for an area under study and
      improvement. Attendance, for example, has four: trend data
      for all students, trend data for subgroups, attendance rates by
      grade levels, and monthly attendance rates. Schools can
      choose what works for their context.