
Page 1014 - How to Make Money in Stocks Trilogy
P. 1014
Start Here 7
11/7/07 “Uptrend under pressure” Nasdaq – 2007 - 2010 Index
11/8/07 “Market in correction”
Weekly Chart 2800
2600
8/19/08 “Uptrend under pressure”
2400
2200
2000
7/29/08 “Confirmed uptrend”
1900
1800
9/5/08 “Market in correction”
1700
1600
Stay in Sync with the Market
The Market Pulse helped investors 1500
protect their money in the 2008 bear
market - and profit when a new bull 3/12/09 “Confirmed uptrend” 1400
cycle began in 2009.
Volume (00)
60,000,000
40,000,000 © 2013 Investor’s Business Daily, Inc.
20,000,000
Dec 07 Mar 08 Jun 08 Sep 08 Dec 08 Mar 09 Jun 09 Sep 09 Dec 09 Mar 10 Jun 10
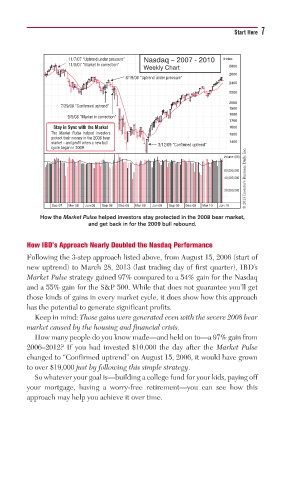
How the Market Pulse helped investors stay protected in the 2008 bear market,
and get back in for the 2009 bull rebound.
How IBD’s Approach Nearly Doubled the Nasdaq Performance
Following the 3-step approach listed above, from August 15, 2006 (start of
new uptrend) to March 28, 2013 (last trading day of first quarter), IBD’s
Market Pulse strategy gained 97% compared to a 54% gain for the Nasdaq
and a 55% gain for the S&P 500. While that does not guarantee you’ll get
those kinds of gains in every market cycle, it does show how this approach
has the potential to generate significant profits.
Keep in mind: Those gains were generated even with the severe 2008 bear
market caused by the housing and financial crisis.
How many people do you know made—and held on to—a 97% gain from
2006–2012? If you had invested $10,000 the day after the Market Pulse
changed to “Confirmed uptrend” on August 15, 2006, it would have grown
to over $19,000 just by following this simple strategy.
So whatever your goal is—building a college fund for your kids, paying off
your mortgage, having a worry-free retirement—you can see how this
approach may help you achieve it over time.