
Page 136 - How to Make Money in Stocks Trilogy
P. 136
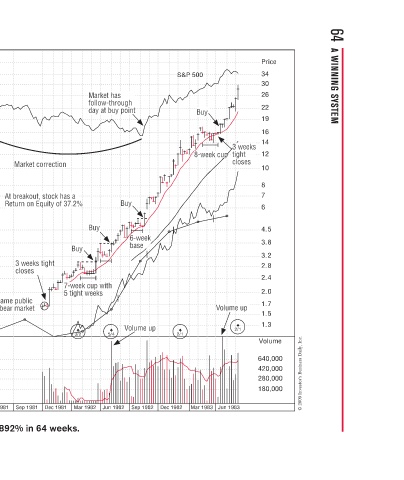
64  A WINNING SYSTEM


            Price  34  30  26  22  19  16  14  12  10  8  7  6  4.5  3.8  3.2  2.8  2.4  2.0  1.7  1.5  1.3  Volume  640,000  420,000  280,000  180,000  © 2009 Investor’s Business Daily, Inc.
                          3 weeks  tight  tight  closes  p  e  2/1

                           p 3  3  3  3  p  p  up  p  up  p  p  Volume up  lu  V  Jun 1983
                    y  Buy  8-week cup 8-week cup  e  -              Mar 1983
              S&P 500  B
                                                         2/1
                                                                     Dec 1982
                                                        p
                                         k  6-week  k  e  Volume up  u  m  Sep 1982
                  h  it  i         y  Buy  w  6  base  b  l  Vo
                 Market has Market h  k  M  o  o  t b  b  Buy  Buy  w  u  s
                 has  s  h  follow-through  o  h  day at buy point day at buy point t  h  5/4  Jun 1982
                    d
                    d
                                   %  %  .  B  y  Buy  7-week cup with  k  w  5 tight weeks 5 tight weeks  e  t  g  3/2  Mar 1982
                             n  c  stock has a  h  c  y  t t  7-  t  Dec 1981
                             Market correction  o  At breakout, stock has a  s At breakout  b Return on Equity of 37.2%  qy  q  t  3 weeks tight  g  t  closes  Stock came public  p  during bear market  Sep 1981


                                                     u
                                                   t
                                                                     Mar 1981 Jun 1981 Dec 1980 Home Depot increased 892% in 64 weeks.
           Only in America…two laid off workers  w  o  e from another hardware store start  a  r  e  anced Home Depot. It ultimately advanced  n  ad  ltimatel  a  It 100-fold in price by the year 2000. y the year 2000  0  y  h fold in price by  p  p  p  Sep 1980 Jun 1980
           s


              Home Depot t

           y
                100
                0
              o
             o
           n
                                                                     Dec 1979 Mar 1980 Sep 1979
           Home Depot–1982  Weekly Chart                             Jun 1979 Mar 1979


          Price =  20*eps   1.80     1.60   1.50   1.40    1.30    1.20    1.10    1.00   0.90   0.80   0.75    0.70    0.65   0.60    0.55    0.50    0.45    0.40    0.35   0.30   0.25   0.23    0.20    0.18    0.16    0.15    0.14    0.13    0.12    0.11    0.10    0.09    0.08    0.07    0.07    0.07    0.06