
Page 285 - How to Make Money in Stocks Trilogy
P. 285
A = Annual Earnings Increases: Look for Big Growth 163
Growth stocks with steady earnings tend to have a stability figure below 20
or 25. Companies with stability ratings over 30 are more cyclical and a little
less dependable in terms of their growth. All other things being equal, you
may want to look for stocks showing a greater degree of sustainability, con-
sistency, and stability in past earnings growth. Some companies that are
growing 25% per year could have a stability rating of 1, 2, or 3. When the
quarterly earnings for several years are plotted on a log-scale chart, the earn-
ings line should be nearly straight, consistently moving up. In most cases
there will be some acceleration in the rate of increase in recent quarters.
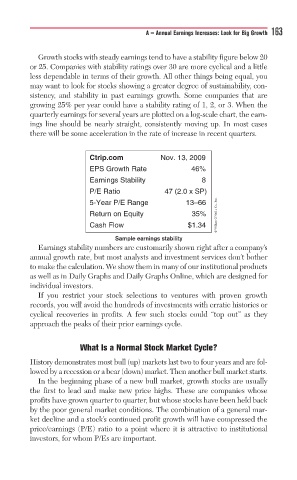
Ctrip.com Nov. 13, 2009
EPS Growth Rate 46%
Earnings Stability 8
P/E Ratio 47 (2.0 x SP)
© William O’Neil + Co., Inc.
5-Year P/E Range 13–66
Return on Equity 35%
Cash Flow $1.34
Sample earnings stability
Earnings stability numbers are customarily shown right after a company’s
annual growth rate, but most analysts and investment services don’t bother
to make the calculation. We show them in many of our institutional products
as well as in Daily Graphs and Daily Graphs Online, which are designed for
individual investors.
If you restrict your stock selections to ventures with proven growth
records, you will avoid the hundreds of investments with erratic histories or
cyclical recoveries in profits. A few such stocks could “top out” as they
approach the peaks of their prior earnings cycle.
What Is a Normal Stock Market Cycle?
History demonstrates most bull (up) markets last two to four years and are fol-
lowed by a recession or a bear (down) market. Then another bull market starts.
In the beginning phase of a new bull market, growth stocks are usually
the first to lead and make new price highs. These are companies whose
profits have grown quarter to quarter, but whose stocks have been held back
by the poor general market conditions. The combination of a general mar-
ket decline and a stock’s continued profit growth will have compressed the
price/earnings (P/E) ratio to a point where it is attractive to institutional
investors, for whom P/Es are important.