
Page 361 - How to Make Money in Stocks Trilogy
P. 361
236 A WINNING SYSTEM
Conventional wisdom or consensus thinking in the market is seldom
right. I never pay any attention to the parade of experts voicing their per-
sonal opinions on the market in print or on TV. It creates entirely too much
confusion and can cost you a great deal of money. In 2000, some strategists
were telling people to buy the dips (short-term declines in price) because
the cash position of mutual funds had increased greatly and all this money
was sitting on the sidelines waiting to be invested. To prove this wrong, all
anyone had to do was look at the General Markets & Sectors page in
Investor’s Business Daily. It showed that while mutual fund cash positions
had indeed risen, they were still significantly below their historical highs
and even below their historical averages.
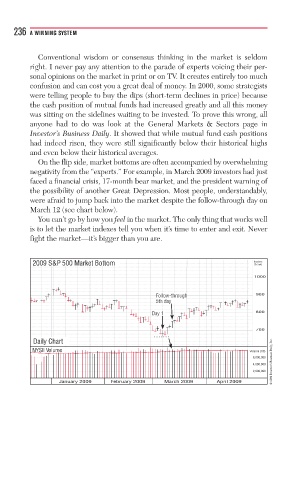
On the flip side, market bottoms are often accompanied by overwhelming
negativity from the “experts.” For example, in March 2009 investors had just
faced a financial crisis, 17-month bear market, and the president warning of
the possibility of another Great Depression. Most people, understandably,
were afraid to jump back into the market despite the follow-through day on
March 12 (see chart below).
You can’t go by how you feel in the market. The only thing that works well
is to let the market indexes tell you when it’s time to enter and exit. Never
fight the market—it’s bigger than you are.
2009 S&P 500 Market Bottom Index
Scale
1000
F Folloollol ww-throughthroughh h h h 900
5th dayday y
5th
y 1111
D Day 1 800
Day
700
Daily Chart
© 2009 Investor’s Business Daily, Inc.
NYSE Volume Volume (00)
8,000,000
4,000,000
2,000,000
January 2009 February 2009 March 2009 April 2009