Page 413 - How to Make Money in Stocks Trilogy
P. 413

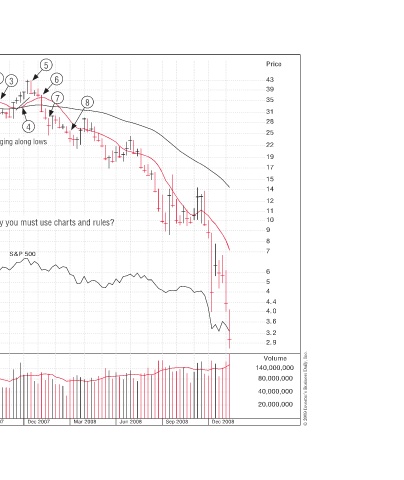
Price  43  39  35  31  28  25  22  19  17  15  14  12  11  10  9  8  7  6  5  4  4.4  4.0  3.6  3.2  2.9  Volume  140,000,000  80,000,000  40,000,000  20,000,000  © 2009 Investor’s Business Daily, Inc.


                                                                       Dec 2008


                                                                       Sep 2008


                                                                       Jun 2008

                                      Do you now see why you must use charts and rules? Do you now see why you must use charts and rules?  m  S&P 500
                                      ?
                                      ?
                   8                  n                                Mar 2008

               6  7                   t  c
            5                                                          Dec 2007
                         Wedging along lows
                       4  o  g
               3         gg  g        o
               2         W            w  s  n                          Sep 2007


                                      y


                                                                       Mar 2007 Jun 2007


                                                                       Dec 2006

                                                         Huge volume spikes   ik  l  o  H  on red weeks on red weeks  w  Sep 2006 Jun 2006


            General Motors   Weekly Chart                              Mar 2006


                                       283
   408   409   410   411   412   413   414   415   416   417   418