Page 619 - How to Make Money in Stocks Trilogy
P. 619

458 Bonus Chapter                                               © 2009 Investor’s Business Daily, Inc.


           Price  50  40  34  30  26  22  19  16  14  12  10  8  7  6  5  4.0  3.4  3.0  2.6  2.2  1.8  Volume  4,000,000  1,600,000  800,000  400,000  200,000


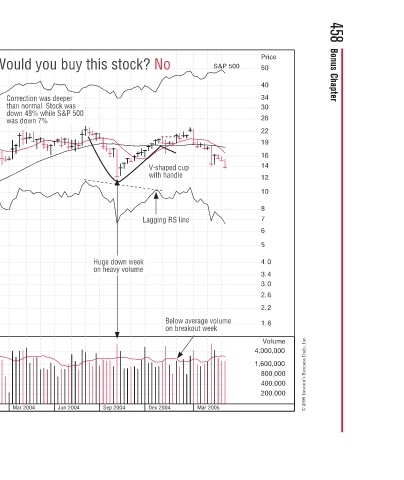
            S&P 500  No      V-shaped cup V shaped cup  a  with handle  d  Lagging RS line Lagging RS line  S  Below average volume  u  ge  e  o  on breakout week  e  o  b  Mar 2005 Dec 2004


             Would you buy this stock? No  ?  stock?  c  s  this  i  buy  u  you  u  y  r Correction was deeper Correction was deeper  d  w than normal. Stock was  than normal. Stock was  a  o  a  0 down 48% while S&P 500  e  w  %  n 7%  7  L  own week own week  w Huge do Huge do  o  o  o  o  u  y volume  u  y on h


                     was down 7%
             Would
             d
                   o
                     as do
                    4
                     as do
                     o
                     o
                  t
             o
                   h
                     w
                  C
                    d
             W
                                                                     Dec 2003 Mar 2004
                                                                     Sep 2003
                                                                     Jun 2003
                                                                     Mar 2003


                                                                     Dec 2002
           Sonic Solutions–2004  Weekly Chart                        Sep 2002 Jun 2002
   614   615   616   617   618   619   620   621   622   623   624