
Page 739 - How to Make Money in Stocks Trilogy
P. 739
40 HOW TO MAKE MONEY IN STOCKS SUCCESS STORIES
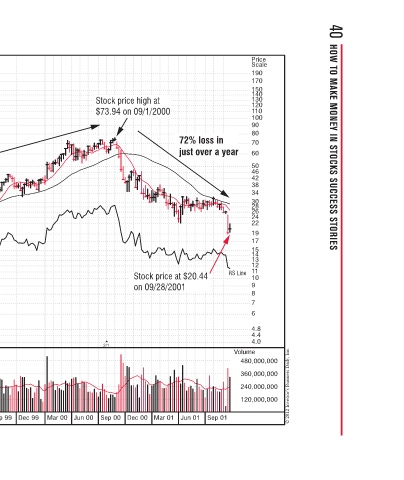
Price Scale 190 170 150 140 130 120 110 100 90 80 70 60 50 46 42 38 34 30 28 26 24 22 19 17 15 14 13 12 11 RS Line 10 9 8 7 6 4.8 4.4 4.0 Volume 480,000,000 360,000,000 240,000,000 120,000,000 © 2012 Investor’s Business Daily, Inc.
72% loss in just over a year Stock price at $20.44 Sep 01 Jun 01
Stock price high at $73.94 on 09/1/2000 on 09/28/2001 2/1 Mar 01 Dec 00 Sep 00
Jun 00
Mar 00
Dec 99
Sep 99
Jun 99
2/1
Mar 99
755% gain in over 4 years Dec 98 Sep 98 Jun 98 Mar 98
Intel (INTC)—Weekly Chart 1996–2001 Manufactures microprocessors, chipsets, network processors, non-volatile memory, and storage for computing markets Kathleen Phillips Stock price at $8.64 on 05/10/1996 2/1 Dec 97 Sep 97 Jun 97 Mar 97 Dec 96