
Page 757 - How to Make Money in Stocks Trilogy
P. 757
Breaking Boards: Successful Trades and Lessons Learned 53
Price Scale 240 220 190 170 150 S&P 500 140 130 120 110 100 90 80 70 60 50 46 42 38 34 RS Line 30 28 26 24 22 19 17 15 14 13 12 11 10 9 8 7 6 Volume 240,000,000 180,000,000 120,000,000 60,000,000 © 2012 Investor’s Business Daily, Inc.
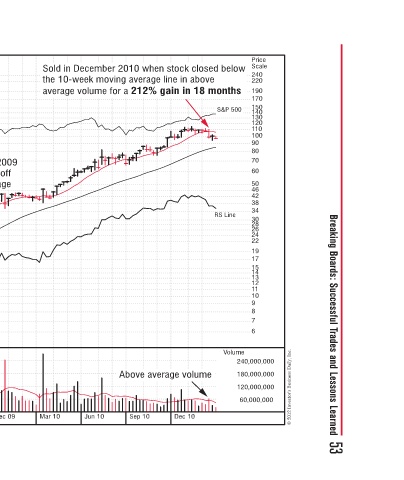
Sold in December 2010 when stock closed below the 10-week moving average line in above average volume for a 212% gain in 18 months Above average volume Dec 10 Sep 10 Jun 10 Mar 10
Bought at $32.65 in July 2009 off a high-volume bounce off the 10-week moving average Above average volume Dec 09 Sep 09 Jun 09 Mar 09
Chinese provider of Internet search, targeted online Baidu Inc Ads (BIDU)—Weekly Chart 2009–2010 advertising, and other Internet content services Ken Chin Stock begins to make move after March 2009 follow-through day Dec 08 Sep 08 Jun 08