Page 820 - How to Make Money in Stocks Trilogy
P. 820

© 2012 Investor’s Business Daily, Inc.
                                                               10,500,000
                                                             14,000,000
                                                                 7,000,000
                                                                   3,500,000
            Scale
           Price
             240
                                              14
                                             15
                                            17
                                                  10
                                                12
                                               13
                                           19
                                       26
                                      28
                                        24
                                         22
                                     30
                                                 11
                                                      7
                                                          5
                                                        6
                                                     8
                                                   9
                                                            Volume
              high-volume big breakdown day.
            High-volume reversal week and
                                                                      Sep 08
                                                                      Jun 08
                                       Up 20% in 3 weeks so hold
                                                                      Mar 08
                                         for 8 weeks rule applied
                                                                      Dec 07
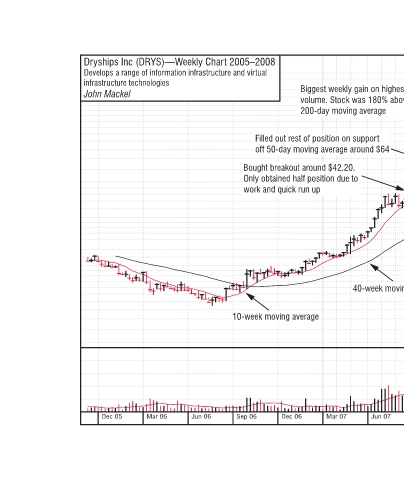
                                                 40-week moving average
                                                                      Sep 07
                Biggest weekly gain on highest  220  190 Sold all to lock in gains from initial   186% gain  170 investment volume. Stock was 180% above   150  140 200-day moving average  130  120  110  100 Filled out rest of position on support   90  80 off 50-day moving average around $64  70  60 Bought breakout
                                                                      Jun 07
                                                                      Mar 07
                                                      10-week moving average
                                                                      Dec 06
            Dryships Inc (DRYS)—Weekly Chart 2005–2008 Develops a range of information infrastructure and virtual  infrastructure technologies  John Mackel  Sep 06  Jun 06  Mar 06  Dec 05
   815   816   817   818   819   820   821   822   823   824   825