Page 892 - How to Make Money in Stocks Trilogy
P. 892

© 2012 Investor’s Business Daily, Inc.
                                                             30,000,000
                                                                 15,000,000
                                                               22,500,000
                                                                   7,500,000
            Scale
           Price
                   380
                    340
                500
              600
                  420
                 460
                                                       17
                                                     19
                                                        15
                                                          13
                                                         14
                                                  26
                                                 28
                                                30
                                                    22
                                                   24
                                                            Volume
                                                                      Mar 09
                                                                      Dec 08
                                                                      Sep 08
                 moving average on big volume
               Sold as stock broke 10-week
                                                                      Jun 08
                                                                      Mar 08
                                                       Huge volume
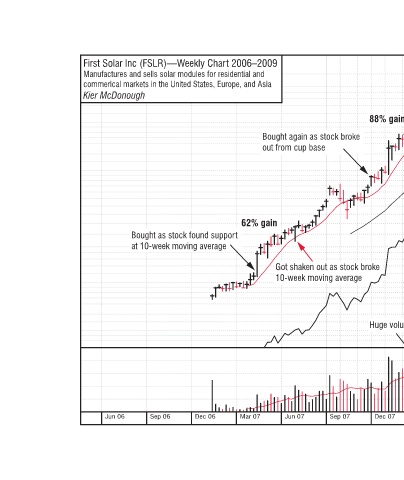
                     88% gain 300  280  260  240  220  190  170  150  140  130  120  110  100  90  80  70  60  RS Line   50  46  42  38  34  Black Belt Trading: Investing Like a Pro 149
                                                                      Dec 07
                        Bought again as stock broke   out from cup base  62% gain  Got shaken out as stock broke   10-week moving average  Sep 07  Jun 07  Mar 07
            First Solar Inc (FSLR)—Weekly Chart 2006–2009   Manufactures and sells solar modules for residential and  commerical markets in the United States, Europe, and Asia  Kier McDonough  Bought as stock found support  at 10-week moving average  Dec 06  Sep 06  Jun 06
   887   888   889   890   891   892   893   894   895   896   897