Page 915 - How to Make Money in Stocks Trilogy
P. 915

© 2012 Investor’s Business Daily, Inc.
                                                             5,400,000
                                                   20
                                                                   1,350,000
                                                                 2,700,000
                                                               4,050,000
                   60
            Scale
           Price
                                                            Volume
                                                                      22
                                                                      8
                                                                       July
                                                                      24
              Sold at $63 on July 19th, 2011
                                                                      10
                for 103% gain in 8 months
                                                                      27 June
                                                                      13
                                                                       May
                                                   200-day moving average
                                                                      29
                                                                      15
                                                                       April
                                                                      1
                                                                      18
                                                                       March
                                                                      4
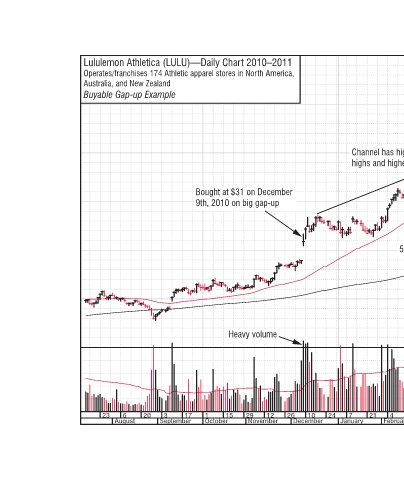
                           Channel has higher   50  highs and higher lows  40  50-day moving average  30  Black Belt Trading: Investing Like a Pro 167
                                                                      18
                                                                       February
                                                                      4
                                                                      21
                                                                      7  January
                                                                      24
                                                                      26 December 10  12  29  November
            Lululemon Athletica (LULU)—Daily Chart 2010–2011 Operates/franchises 174 Athletic apparel stores in North America,  Australia, and New Zealand Buyable Gap-up Example  Bought at $31 on December   9th, 2010 on big gap-up  15  1  17  3  20  6  23  October September  August
                                                         Heavy volume
   910   911   912   913   914   915   916   917   918   919   920