
Page 114 - TCS ICT Book 7
P. 114
The City School 2021-2022
Flow Charts
A flowchart is a type of diagram that represents an algorithm, workflow or process.
The flowchart shows the steps as boxes of various kinds, and their order by connecting
the boxes with arrows. Flowcharts are used in analyzing, designing, documenting or
managing a process or program in various fields.
Flow Chart Symbols
Terminal
The rounded rectangles, or terminal points,
indicate the flowchart’s starting and ending
points.
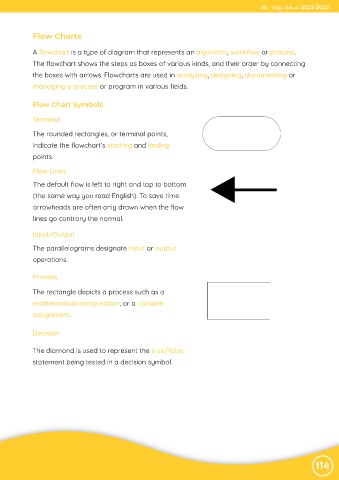
Flow Lines
The default flow is left to right and top to bottom
(the same way you read English). To save time
arrowheads are often only drawn when the flow
lines go contrary the normal.
Input/Output
The parallelograms designate input or output
operations.
Process
The rectangle depicts a process such as a
mathematical computation, or a variable
assignment.
Decision
The diamond is used to represent the true/false
statement being tested in a decision symbol.
114