
Page 72 - SP015 Past Years PSPM Chapter 6 -14 Ver 2020
P. 72
PHYSICS PSPM SEM 1 1999 - 2017
PSPM JAN 1999/2000 SF015/2 No. 14(b)
-2
11. p (N m )
K L
5
1
J M
3
V (m )
FIGURE 14.2
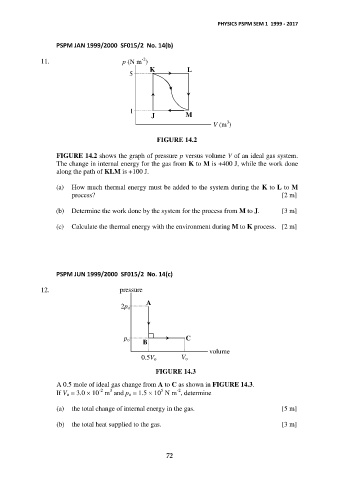
FIGURE 14.2 shows the graph of pressure p versus volume V of an ideal gas system.
The change in internal energy for the gas from K to M is +400 J, while the work done
along the path of KLM is +100 J.
(a) How much thermal energy must be added to the system during the K to L to M
process? [2 m]
(b) Determine the work done by the system for the process from M to J. [3 m]
(c) Calculate the thermal energy with the environment during M to K process. [2 m]
PSPM JUN 1999/2000 SF015/2 No. 14(c)
12. pressure
2p o A
p o C
B
V o volume
0.5V o
FIGURE 14.3
A 0.5 mole of ideal gas change from A to C as shown in FIGURE 14.3.
-2
-2
5
3
If V o = 3.0 10 m and p o = 1.5 10 N m , determine
(a) the total change of internal energy in the gas. [5 m]
(b) the total heat supplied to the gas. [3 m]
72