
Page 467 - รวมไฟล์วารสาร ปีที่ 8 ฉบับที่ 1
P. 467
inclined to use the frequency of one times per week, the less they agree that the longer the
consumers with high economic risk spend on Alipay.
Finally, we use frequency and time as dependent variables, perceive ease of use,
perceive usefulness, perceive risk and use scenario as independent variables to conduct
disorderly multinomial logistic regression analysis.
In terms of usage frequency, we can see that the higher the consumer's recognition
of ease of use, the more likely it is to use frequency more than 7 times a week. The more likely
it is to use more than 7 times a week, the more worried about economic risks, the less frequent
it will be used. In terms of usage time, the higher the recognition degree of ease of use, the
greater the possibility that the usage time is longer than one year, and the shorter the usage time
with economic risk, while perceived usefulness has little effect on the usage time.
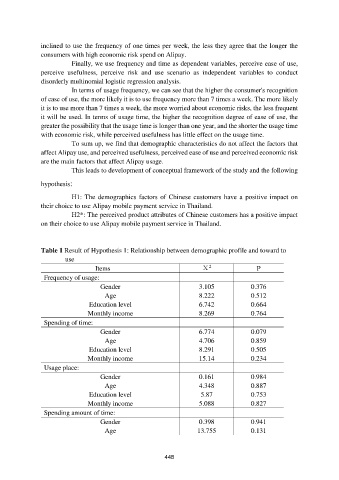
To sum up, we find that demographic characteristics do not affect the factors that
affect Alipay use, and perceived usefulness, perceived ease of use and perceived economic risk
are the main factors that affect Alipay usage.
This leads to development of conceptual framework of the study and the following
hypothesis:
H1: The demographics factors of Chinese customers have a positive impact on
their choice to use Alipay mobile payment service in Thailand.
H2*: The perceived product attributes of Chinese customers has a positive impact
on their choice to use Alipay mobile payment service in Thailand.
Table 1 Result of Hypothesis 1: Relationship between demographic profile and toward to
use
2
Items Χ P
Frequency of usage:
Gender 3.105 0.376
Age 8.222 0.512
Education level 6.742 0.664
Monthly income 8.269 0.764
Spending of time:
Gender 6.774 0.079
Age 4.706 0.859
Education level 8.291 0.505
Monthly income 15.14 0.234
Usage place:
Gender 0.161 0.984
Age 4.348 0.887
Education level 5.87 0.753
Monthly income 5.088 0.827
Spending amount of time:
Gender 0.398 0.941
Age 13.755 0.131
448