
Page 487 - รวมไฟล์วารสาร ปีที่ 8 ฉบับที่ 1
P. 487
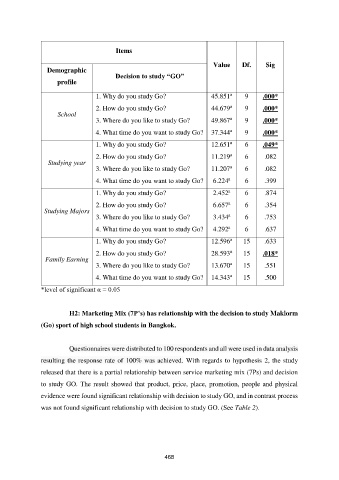
Items

                                                                            Value     Df.     Sig
                  Demographic
                                          Decision to study “GO”
                     profile

                                                                                  a
                                   1. Why do you study Go?                 45.851      9     .000*
                                                                                  a
                                   2. How do you study Go?                 44.679      9     .000*
                     School
                                                                                  a
                                   3. Where do you like to study Go?       49.867      9     .000*
                                                                                  a
                                   4. What time do you want to study Go?  37.344       9     .000*
                                                                                  a
                                   1. Why do you study Go?                 12.651      6     .049*
                                                                                  a
                                   2. How do you study Go?                 11.219      6      .082
                  Studying year
                                                                                  a
                                   3. Where do you like to study Go?       11.207      6      .082
                                                                                 a
                                   4. What time do you want to study Go?    6.224      6      .399
                                                                                 a
                                   1. Why do you study Go?                  2.452      6      .874
                                                                                 a
                                   2. How do you study Go?                  6.657      6      .354
                 Studying Majors
                                                                                 a
                                   3. Where do you like to study Go?        3.434      6      .753
                                                                                 a
                                   4. What time do you want to study Go?    4.292      6      .637
                                                                                  a
                                   1. Why do you study Go?                 12.596     15      .633
                                                                                  a
                                   2. How do you study Go?                 28.593     15     .018*
                 Family Earning
                                                                                  a
                                   3. Where do you like to study Go?       13.670     15      .551
                                                                                  a
                                   4. What time do you want to study Go?  14.343      15      .500
               *level of significant α = 0.05


                         H2: Marketing Mix (7P’s) has relationship with the decision to study Maklorm
               (Go) sport of high school students in Bangkok.


                         Questionnaires were distributed to 100 respondents and all were used in data analysis
               resulting the response rate of 100% was achieved. With regards to hypothesis  2, the study

               released that there is a partial relationship between service marketing mix (7Ps) and decision
               to study GO. The result showed that product, price, place, promotion, people and physical

               evidence were found significant relationship with decision to study GO, and in contrast process
               was not found significant relationship with decision to study GO. (See Table 2).


                                                           468