
Page 497 - รวมไฟล์วารสาร ปีที่ 8 ฉบับที่ 1
P. 497
Research Methodology
This research study discussed the relationship between demographic profile,
perceived benefit, integrated marketing communication (IMC tools) and purchasing intention
of Cambodian consumers on healthcare services in Thailand according to the following
constructs:
1. Demographic profile: gender, age, marital status, income range (annual),
Occupation, education, and city/province of resident
2. Perceived benefit: emotional benefit and functional benefit
3. Integrated marketing communication (IMC tools): online channel and offline
channel
4. Purchasing intention: expectation in treatment and cost of treatment
This research study aims to collect data from the Cambodian patients who visit
hospital in Thailand in order to receive medical check-up and treatment. There are 5 hospitals
in Bangkok, Thailand which are selected to conduct the study. Those include Bangkok hospital,
Phyathai 1 hospital, Phyathai 2 hospital, Phyathai 3 hospital, and Bumrongrad hospital. Due to
the limitation of the study, the researcher collected need to specify the limited number of the
respondents to collect data and analyze the data. Therefore, the researcher considered 100
respondents at minimum as a sample size.
In order to get equal respondents from the selected hospitals, the researcher equally
separated the amount of questionnaire to the patient from Bangkok hospital, Phyathai 1
hospital, Phyathai 2 hospital, Phyathai 3 hospital, and Bumrongrad hospital. Quota sampling
was adopted into this research study since the respondent can be managed for certain
characteristics (Malhotra, 2017).
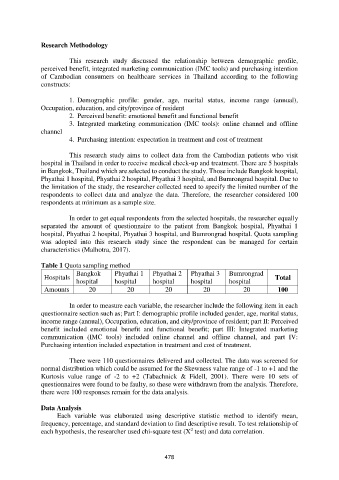
Table 1 Quota sampling method
Bangkok Phyathai 1 Phyathai 2 Phyathai 3 Bumrongrad
Hospitals Total
hospital hospital hospital hospital hospital
Amounts 20 20 20 20 20 100
In order to measure each variable, the researcher include the following item in each
questionnaire section such as; Part I: demographic profile included gender, age, marital status,
income range (annual), Occupation, education, and city/province of resident; part II: Perceived
benefit included emotional benefit and functional benefit; part III: Integrated marketing
communication (IMC tools) included online channel and offline channel, and part IV:
Purchasing intention included expectation in treatment and cost of treatment.
There were 110 questionnaires delivered and collected. The data was screened for
normal distribution which could be assumed for the Skewness value range of -1 to +1 and the
Kurtosis value range of -2 to +2 (Tabachnick & Fidell, 2001). There were 10 sets of
questionnaires were found to be faulty, so these were withdrawn from the analysis. Therefore,
there were 100 responses remain for the data analysis.
Data Analysis
Each variable was elaborated using descriptive statistic method to identify mean,
frequency, percentage, and standard deviation to find descriptive result. To test relationship of
2
each hypothesis, the researcher used chi-square test (X test) and data correlation.
478