
Page 533 - รวมไฟล์วารสาร ปีที่ 8 ฉบับที่ 1
P. 533
Methodology
Population: consumers all Chinese who purchase Thai amulets in Thailand
Sample:Chinese who purchased Thai amulets in Bangkok
Sample number: 100 respondents
Sample size:Because the number of population is inexplicitness, the researcher use
Taro Yamane table to calculate the appropriate sample size at 95% of confidence level,
0.05% sampling error.
Data collection method
This study collected 2 types of data which are:
1. Primary Data – using the questionnaire to collect the data from Thai amulets’
Chinese customer in Bangkok
2. Secondary Data – using the documentary research to collect the data from text
books, article and related research to develop the conceptual framework of the study.
Data analysis
1. Descriptive Statistic – Frequency, percentage, mean and standard deviation.
2. Inferential Statistics—Chi-Square was used to test the relationships between
demographic profile, motivation factors and decision to purchase Amulets of Chinese
in Bangkok. .The confidence level of 95% or < 0.05 was adopted to test the
hypotheses of the Study
Results and Discussion
Chi-square analysis was used to test the hypothesis 1
H1: Demographic profile has effect on decision to purchase Thai amulets of
Chinese consumers in Bangkok
Demographic profile data described by the Age, Gender, Occupation, Monthly
income, Residence Area in China, Education level.
This study found a partly support of H1 as follows:
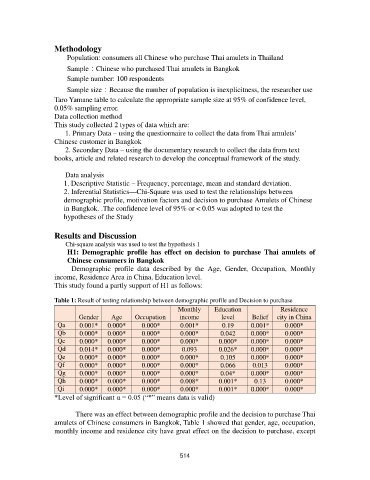
Table 1: Result of testing relationship between demographic profile and Decision to purchase
Monthly Education Residence
Gender Age Occupation income level Belief city in China
Qa 0.001* 0.000* 0.000* 0.001* 0.19 0.001* 0.000*
Qb 0.000* 0.000* 0.000* 0.000* 0.042 0.000* 0.000*
Qc 0.000* 0.000* 0.000* 0.000* 0.000* 0.000* 0.000*
Qd 0.014* 0.000* 0.000* 0.093 0.026* 0.000* 0.000*
Qe 0.000* 0.000* 0.000* 0.000* 0.105 0.000* 0.000*
Qf 0.000* 0.000* 0.000* 0.000* 0.066 0.013 0.000*
Qg 0.000* 0.000* 0.000* 0.000* 0.04* 0.000* 0.000*
Qh 0.000* 0.000* 0.000* 0.008* 0.001* 0.13 0.000*
Qi 0.000* 0.000* 0.000* 0.000* 0.001* 0.000* 0.000*
*Level of significant α = 0.05 (“*” means data is valid)
There was an effect between demographic profile and the decision to purchase Thai
amulets of Chinese consumers in Bangkok, Table 1 showed that gender, age, occupation,
monthly income and residence city have great effect on the decision to purchase, except
514