
Page 56 - ssr_16
P. 56
2.1.5 Furnish the number of students admitted in the College in the last four
academic years in numbers.
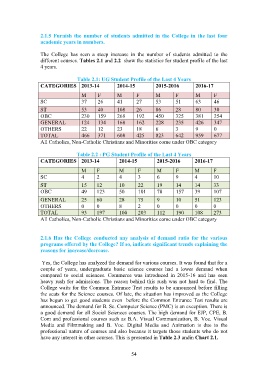
The College has seen a steep increase in the number of students admitted to the
different courses. Tables 2.1 and 2.2 show the statistics for student profile of the last
4 years.
Table 2.1: UG Student Profile of the Last 4 Years
CATEGORIES 2013-14 2014-15 2015-2016 2016-17
M F M F M F M F
SC 37 26 41 27 53 51 63 46
ST 53 40 108 26 86 28 80 30
OBC 230 159 268 192 450 325 381 254
GENERAL 124 134 168 162 228 235 426 347
OTHERS 22 12 23 18 6 3 9 0
TOTAL 466 371 608 425 823 642 959 677
All Catholics, Non-Catholic Christians and Minorities come under OBC category
Table 2.2 : PG Student Profile of the Last 4 Years
CATEGORIES 2013-14 2014-15 2015-2016 2016-17
M F M F M F M F
SC 4 2 4 3 6 9 4 10
ST 15 12 10 22 19 14 14 33
OBC 49 123 50 101 78 157 39 107
GENERAL 25 60 28 75 9 10 51 123
OTHERS 0 0 8 2 0 0 0 0
TOTAL 93 197 100 203 112 190 108 273
All Catholics, Non-Catholic Christians and Minorities come under OBC category
2.1.6 Has the College conducted any analysis of demand ratio for the various
programs offered by the College? If so, indicate significant trends explaining the
reasons for increase/decrease.
Yes, the College has analyzed the demand for various courses. It was found that for a
couple of years, undergraduate basic science courses had a lower demand when
compared to social sciences. Commerce was introduced in 2015-16 and has seen
heavy rush for admissions. The reason behind this rush was not hard to find. The
College waits for the Common Entrance Test results to be announced before filling
the seats for the Science courses. Of late, the situation has improved as the College
has begun to get good students even before the Common Entrance Test results are
announced. The demand for B. Sc. Computer Science (PMC) is an exception. There is
a good demand for all Social Sciences courses. The high demand for EJP, CPE, B.
Com and professional courses such as B.A. Visual Communication, B. Voc. Visual
Media and Filmmaking and B. Voc. Digital Media and Animation is due to the
professional nature of courses and also because it targets those students who do not
have any interest in other courses. This is presented in Table 2.3 andin Chart 2.1.
54