
Page 123 - ENGLISH 9
P. 123
Study Time
1. Look at the interpretation of the graph below, and interpret the graph
above in a similar way.
6000
5000 4850 4878 4810
4250
4000
3349 3015
Curriculum Development Centre
3000 2666 2846 2909 2846
2000
1000
0
March April May June July August September October November December
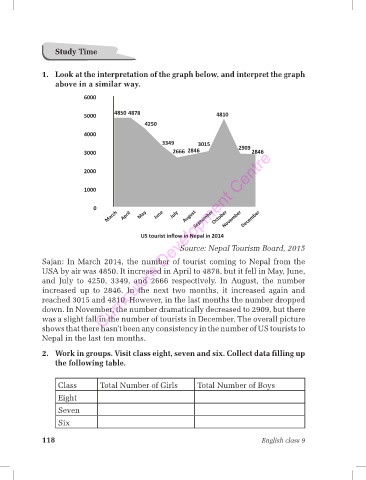
US tourist inflow in Nepal in 2014
Source: Nepal Tourism Board, 2015
Sajan: In March 2014, the number of tourist coming to Nepal from the
USA by air was 4850. It increased in April to 4878, but it fell in May, June,
and July to 4250, 3349, and 2666 respectively. In August, the number
increased up to 2846. In the next two months, it increased again and
reached 3015 and 4810. However, in the last months the number dropped
down. In November, the number dramatically decreased to 2909, but there
was a slight fall in the number of tourists in December. The overall picture
shows that there hasn’t been any consistency in the number of US tourists to
Nepal in the last ten months.
2. Work in groups. Visit class eight, seven and six. Collect data filling up
the following table.
Class Total Number of Girls Total Number of Boys
Eight
Seven
Six
118 English class 9