
Page 125 - English Reader - 7
P. 125
9.2. Graphs and charts are visual representation of data in the form of
points, lines, bars and pie chart. They have important statistics
in them. Explaining the data or information they have in oral
or written form is caleed intrepretation. Look at the pie-chart
below and read its intrepretation.
The above diagram is a pie chart. It shows the number of votes each
candidate received in the election of school captain.
According to the chart, Mr. Rehal receieved 60 votes and was elected
the captain. Ms. Suhana received a total of 21 votes. Similarly Ms.
Dilruba was voted for by 13 voters. Mr. Rubel, the last candidate
received a toal of 6 votes.
From the chart we can conclude that Mr. Rehal not only won the
election but also proved himself to be the most eligible candidate
receiving 60% of the total votes.
9.3. Intrepret the following diagrams.
a. A bar chart
b. A pie chart
10 Reading Time 2
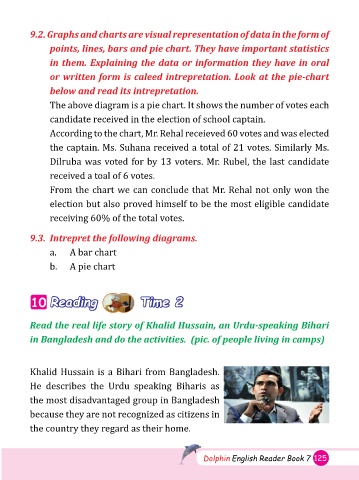
Read the real life story of Khalid Hussain, an Urdu-speaking Bihari
in Bangladesh and do the activities. (pic. of people living in camps)
Khalid Hussain is a Bihari from Bangladesh.
He describes the Urdu speaking Biharis as
the most disadvantaged group in Bangladesh
because they are not recognized as citizens in
the country they regard as their home.
Dolphin English Reader Book 7 125