
Page 219 - ENGLISH 10
P. 219
B. Time for writing
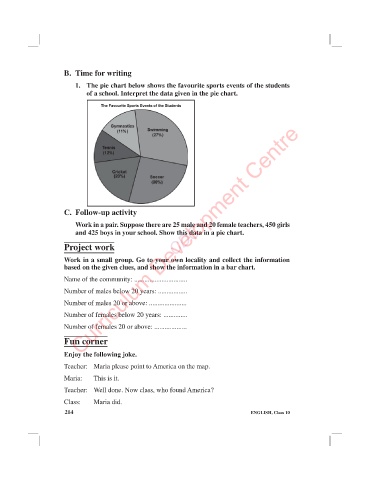
1. The pie chart below shows the favourite sports events of the students
of a school. Interpret the data given in the pie chart.
Curriculum Development Centre
C. Follow-up activity
Work in a pair. Suppose there are 25 male and 20 female teachers, 450 girls
and 425 boys in your school. Show this data in a pie chart.
Project work CDC
Work in a small group. Go to your own locality and collect the information
based on the given clues, and show the information in a bar chart.
Name of the community: ...............................
Number of males below 20 years: .................
Number of males 20 or above: ......................
Number of females below 20 years: ..............
Number of females 20 or above: ...................
Fun corner
Enjoy the following joke.
Teacher: Maria please point to America on the map.
Maria: This is it.
Teacher: Well done. Now class, who found America?
Class: Maria did.
214 ENGLISH, Class 10