
Page 196 - The Atlas of Economic Complexity
P. 196
MAPPING PATHS TO PROSPERITY | 197
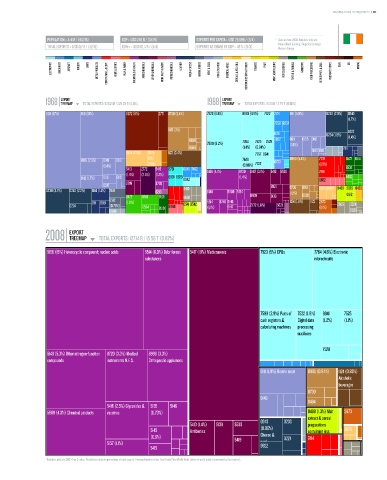
POPULATION ≥ 4.4 M / (102/16) GDP ≥ USD 266 b / (34/15) EXPORTS PER CAPITA ≥ USD 28,696 / (9/4) * Data are from 2008. Numbers indicate:
value (World Ranking / Regional Ranking).
TOTAL EXPORTS ≥ USD 127 b / (32/12) GDPpc ≥ USD 60,178 / (5/4) EXPORTS AS SHARE OF GDP ≥ 48 % (31/3) Western Europe.
ELECTRONICS MACHINERY AIRCRAFT bOILERS SHIPS METAL PRODUCTS CONSTR. MATL. & EqPT. HOME & OFFICE PULP & PAPER CHEMICALS & HEALTH AGROCHEMICALS OTHER CHEMICALS INOR. SALTS & ACIDS PETROCHEMICALS LEATHER MILK & CHEESE ANIMAL FIbERS MEAT & EGGS FISH & SEAFOOD TROPICAL AGRIC. CEREALS & vEG. OILS COTTON/RICE/SOY & OTHERS TObACCO FRUIT MISC. AGRICULTURE NOT CLASSIFIED TEXTILE & FAbRICS GARMENTS FOOD PROCESSING bEER/SPIRITS & CIGS. PRECIOUS STONES COAL OIL MINING
EXPORT EXPORT
1968 TREEMAP TOTAL EXPORTS: 921.12 M / 228.33 b (0,4%) 1988 TREEMAP TOTAL EXPORTS: 18.36 b / 2.79 T (0.66%)
Total Exports: 921.12 M / 228.33 B (0.4%) Total Exports: 18.36 B / 2.79 T (0.66%)
0011 (17%) 0111 (13%) 6672 (8%) 2771 0730 (3.4%) 7523 (6.6%) 8983 (3.9%) 7522 7721 0111 (5.9%) 0230 (2.9%) 0240
(1.7%)
7758 6954
0121 (3%) 5922
6251 0224 (1.8%) (1.4%)
0620 7764 7525 7528 7822 0011 0015 0112
7599 (6.2%) (1.6%)
0980 (1.4%) (0.84%) 2111
2874 (2.3%) 2875 1123 (3.4%) 7757 8841 0149 0116
(1%) 0980 (5.4%) 7731 6522 6514
0015 (2.5%) 0149 0113 7649 6733
(1.4%) 2789 (0.96%) 7722 (1.3%) 6534
5413 2772 5415 8731 6940 7452 5156 (4.1%) 8720 5417 (3.1%) 5413 5530 7414
(1.4%) (2.5%) (1.2%)
0112 (1.7%) 0116 0115 6931 6623 8942 (1.4%) 6652 8462
0819 8720
0012 8921 0730 8931
0230 (3.7%) 0240 (2.2%) 6114 (1.4%) 2681 6210 9410 5148 5989 5154 (1.1%) 2875 6998 0488 2929 0430
8472 8510 6521 6658 8939 5139 0620 0612
6512 1124 (1.9%) 1123 2873
2111 2919 (1.9%) 0541 0542 5514 8748 5146 2665 3224
0224 (0.78%) 6584 6519 8960 (1.1%) 5147 2772 (1.8%) 5621 (1.1%)
0360 8924
EXPORT
2008 TREEMAP TOTAL EXPORTS: 127.14 b / 15.56 T (0.82%)
Total Exports: 127.14 B / 15.56 T (0.82%)
5156 (15%) Heterocyclic compound; nucleic acids 5514 (6.9%) Odoriferous 5417 (18%) Medicaments 7523 (5%) CPUs 7764 (4.6%) Electronic
substances microcircuits
7599 (2.9%) Parts of 7522 (1.9%) 8841 7525
cash registers & Digital data (1.2%) (1.1%)
calculating machines processing
machines
7528
5148 (5.3%) Other nitrogen-function 8720 (3.3%) Medical 8996 (3.3%)
compounds instruments N.E.S. Orthopaedic appliances
0111 (1.9%) Bovine meat 0980 (0.94%) 1124 (0.85%)
Alcoholic
beverages
0730
0149
0484
5416 (2.5%) Glycosides & 5155 5146
5989 (4.3%) Chemical products vaccines (0.73%) 0488 (1.3%) Malt 2873
extract & cereal
0240 0230
5413 (1.4%) 5139 5530 preparations
5145 Antibiotics (0.86%) containing less 2875
(0.6%) 5419 Cheese & 0224 than 50% cocoa
7414
5157 (1.1%) curd
5922
5415
* Numbers indicate SITC-4 rev 2 codes. Parenthesis indicate percentage of total exports. Treemap Headers show: Total Trade/Total World Trade (share of world trade represented by the country).