
Page 346 - The Atlas of Economic Complexity
P. 346
MAPPING PATHS TO PROSPERITY | 347
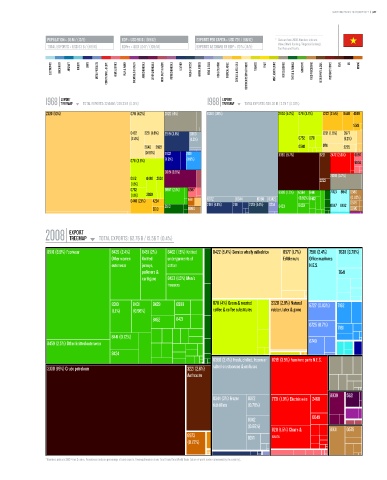
POPULATION ≥ 86 M / (13/5) GDP ≥ USD 90 b / (59/12) EXPORTS PER CAPITA ≥ USD 728 / (86/12) * Data are from 2008. Numbers indicate:
value (World Ranking / Regional Ranking).
TOTAL EXPORTS ≥ USD 63 b / (48/10) GDPpc ≥ USD 1,047 / (109/14) EXPORTS AS SHARE OF GDP ≥ 70 % (14/5) East Asia and Pacific.
ELECTRONICS MACHINERY AIRCRAFT bOILERS SHIPS METAL PRODUCTS CONSTR. MATL. & EqPT. HOME & OFFICE PULP & PAPER CHEMICALS & HEALTH AGROCHEMICALS OTHER CHEMICALS INOR. SALTS & ACIDS PETROCHEMICALS LEATHER MILK & CHEESE ANIMAL FIbERS MEAT & EGGS FISH & SEAFOOD TROPICAL AGRIC. CEREALS & vEG. OILS COTTON/RICE/SOY & OTHERS TObACCO FRUIT MISC. AGRICULTURE NOT CLASSIFIED TEXTILE & FAbRICS GARMENTS FOOD PROCESSING bEER/SPIRITS & CIGS. PRECIOUS STONES COAL OIL MINING
EXPORT EXPORT
1968 TREEMAP TOTAL EXPORTS: 32.04 M / 228.33 b (0.01%) 1988 TREEMAP TOTAL EXPORTS: 539.00 M / 2.79 T (0.02%)
Total Exports: 32.04 M / 228.33 B (0.01%) Total Exports: 539.00 M / 2.79 T (0.02%)
2320 (53%) 0741 (4.2%) 2820 (4%) 0360 (38%) 2924 (5.2%) 0711 (3.7%) 2222 (2.5%) 0440 4249
5513
0422 2221 (1.8%) 2919 (3.1%) 0360 2221 (1.6%) 0577
(2.4%) (1.2%) 0752 0751 (1.2%)
2640 2922 0548 0741 2225
(0.96%) 7932 7821 3330 (9.7%) 3221 2472 (2.6%) 6597
0711 (3.8%) (1.8%) (1.8%) 6953
0819 (3.6%)
0812 0488 2924 3222 2820 (3.2%)
(1.1%)
0752 8997 (2.1%) 6597 8997 (1.7%) 6584 8441 7763 8942 0586
(1.1%) 2929 (0.92%) 8462 (0.87%)
0440 (2.1%) 4234 6611 0372 0344 0350 0342 0579
2613 2919 (1.8%) 2111 2120 (1.4%) 0251 8423 8429 8947 8482
5513 0980 0980
EXPORT
2008 TREEMAP TOTAL EXPORTS: 62.76 b / 15.56 T (0.4%)
Total Exports: 62.76 B / 15.56 T (0.4%)
8510 (8.9%) Footwear 8439 (2.4%) 8451 (2%) 8462 (1.5%) Knitted 0422 (5.4%) Semi or wholly milled rice 0577 (1.7%) 7518 (2.4%) 7638 (0.78%)
Other women Knitted undergarments of Edible nuts Office machines
outerwear jerseys, cotton N.E.S.
pullovers & 7641
cardigans 8423 (1.5%) Men's
trousers
8310 8431 8429 6589 0711 (4%) Green & roasted 2320 (2.9%) Natural 6727 (0.83%) 7162
(1.1%) (0.98%) coffee & coffee substitutes rubber, latex & gums
8452 8421
6725 (0.7%)
7161
8441 (0.72%)
8459 (2.5%) Other knitted outerwear 6749
8424
0360 (3.4%) Fresh, chilled, frozen or 8219 (3.5%) Furniture parts N.E.S.
3330 (19%) Crude petroleum 3221 (2.6%) salted crustaceans & molluscs
Anthracite
8939 5621
0344 (3%) Frozen 0372 7731 (1.9%) Electric wire 2460
fish fillets (0.78%)
6649
0342
(0.66%)
8211 (1.5%) Chairs & 8931 0579
8973 0371 seats
(0.72%)
* Numbers indicate SITC-4 rev 2 codes. Parenthesis indicate percentage of total exports. Treemap Headers show: Total Trade/Total World Trade (share of world trade represented by the country).