
Page 5 - Offer Presentation Brochure
P. 5
€2.70 €3.10 €3.30 €3.55
€2.50
€2.30
€2.00
€1.80
€1.50
€1.44
€1.38
SALES GROWTH FROM 2007 TO 2017 (IN BILLIONS OF EUROS)
2007
2009
2008
2010
2007 2008 2009 2010 2011 2012 2013 2014 2015 2016 2016 2017 2017
2015
2014
2013
2012
2011
17,063 17,542 17,473 19,496 20,343 21,638 22,124 22,532 25,257 25,837 26,024
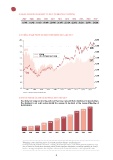
L’ORÉAL SHARE PRICE (IN EUROS) BETWEEN 2007 AND 2017
8,000
7,000
L’Oréal
€184.95
CAC40
5,541.76
6,000
L'Oréal
CAC 40 (Right-hand scale)
5,000
CAC40
5,312.56
4,000
3,000
L’Oréal
€75.90
2,000
1,000
0
Source: Thomas Reuters Datastream
UNIT DIVIDEND (IN EUROS) BETWEEN 2007 AND 2017
The dividend corresponds to the portion of the Group net profit that is distributed to shareholders.
The dividend is not paid automatically; its payment is decided at the General Meeting of
Shareholders.
€3.55
€3.30
€3.10
€2.70
€2.50
€2.30
€2.00
€1.80
€1.38 €1.44 €1.50
2007 2008 2009 2010 2011 2012 2013 2014 2015 2016 2017
Warning: past performance does not predict future performance
L’Oréal periodically publishes documents, including financial information, on its website (www.loreal-finance.com).
You are invited to consult these documents, which contain important information on subjects including the Group’s
business, strategy and objectives, the risk factors inherent in the Group and its business, and its financial results.
8,000
5
7,000
L’Oréal
€184.95
CAC40
5,541.76
6,000
L'Oréal
CAC 40 (Right-hand scale)
5,000
CAC40
5,312.56
4,000
3,000
L’Oréal
€75.90
2,000
1,000
0