
Page 51 - Trigonometry
P. 51
y(t) -.65 -.84 -.96 -.99 -.94 -.8 -.58
x(t) -.99 -.89 -.49 0.08 0.63 0.96 0.95
y(t) -.32 -.03 0.27 0.54 0.76 0.92 0.99
x(t) 0.61 0.06 -.51 -.90 -.98 -.72 -.12
y(t) 0.98 0.87 0.69 0.45 0.17 -.12 -.41
x(t) 0.39 0.84 1 0.81 0.33 -.25 -.75
y(t) -.66 -.85 -.97 -.99 -.93 -.79
x(t) -1 -.88 -.46 0.11 0.65 0.96
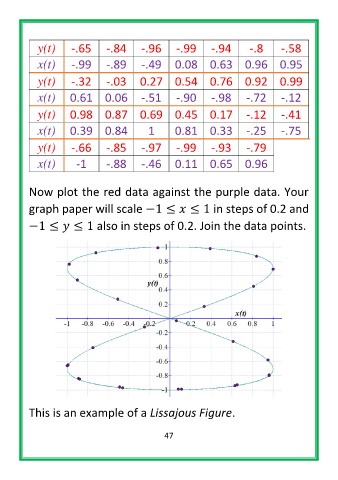
Now plot the red data against the purple data. Your
graph paper will scale −1 ≤ ≤ 1 in steps of 0.2 and
−1 ≤ ≤ 1 also in steps of 0.2. Join the data points.
This is an example of a Lissajous Figure.
47