
Page 37 - More Higher algebra
P. 37
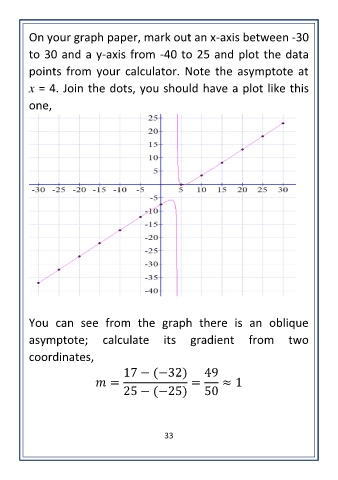
On your graph paper, mark out an x-axis between -30

        to 30 and a y-axis from -40 to 25 and plot the data
        points from your calculator. Note the asymptote at

        x = 4. Join the dots, you should have a plot like this

        one,


        You  can  see  from  the  graph  there  is  an  oblique

        asymptote;  calculate  its  gradient  from  two
        coordinates,

                                17 − (−32)          49
                            =                   =       ≈ 1
                                25 − (−25)          50


                                          33