
Page 360 - Budget Book FY2020-2021
P. 360
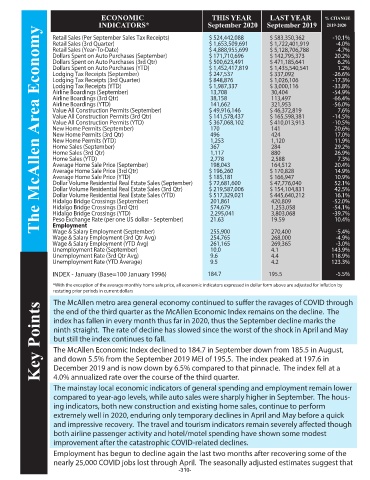
ECONOMIC                            THIS YEAR          LAST YEAR         % CHANGE
                                  INDICATORS*                         September 2020     September 2019      2019-2020
              The McAllen Area Economy
                  Retail Sales (Per September Sales Tax Receipts)      $ 524,442,088       $ 583,350,362       -10.1%
                  Retail Sales (3rd Quarter)                           $ 1,653,509,691     $ 1,722,401,919      -4.0%
                  Retail Sales (Year-To-Date)                          $ 4,888,955,699     $ 5,128,706,788      -4.7%
                  Dollars Spent on Auto Purchases (September)          $ 171,710,696       $ 142,795,373        20.2%
                  Dollars Spent on Auto Purchases (3rd Qtr)            $ 500,623,491       $ 471,185,641         6.2%
                  Dollars Spent on Auto Purchases (YTD)                $ 1,452,417,819     $ 1,435,540,541       1.2%
                  Lodging Tax Receipts (September)                     $ 247,537           $ 337,092           -26.6%
                  Lodging Tax Receipts (3rd Quarter)                   $ 848,876           $ 1,026,106         -17.3%
                  Lodging Tax Receipts (YTD)                           $ 1,987,337         $ 3,000,116         -33.8%
                  Airline Boardings (September)                         13,708              30,404             -54.9%
                  Airline Boardings (3rd Qtr)                           38,158              113,497            -66.4%
                  Airline Boardings (YTD)                               141,662             321,953            -56.0%
                  Value All Construction Permits (September)           $ 49,916,146        $ 46,372,819          7.6%
                  Value All Construction Permits (3rd Qtr)             $ 141,578,437       $ 165,598,381       -14.5%
                  Value All Construction Permits (YTD)                 $ 367,068,102       $ 410,013,913       -10.5%
                  New Home Permits (September)                          170                 141                 20.6%
                  New Home Permits (3rd Qtr)                            496                 424                 17.0%
                  New Home Permits (YTD)                                1,253               1,120               11.9%
                  Home Sales (September)                                367                 284                 29.2%
                  Home Sales (3rd Qtr)                                  1,117               880                 26.9%
                  Home Sales (YTD)                                      2,778               2,588                7.3%
                  Average Home Sale Price (September)                   198,043             164,512             20.4%
                  Average Home Sale Price (3rd Qtr)                    $ 196,260           $ 170,828            14.9%
                  Average Home Sale Price (YTD)                        $ 185,181           $ 166,947            10.9%
                  Dollar Volume Residential Real Estate Sales (September)    $ 72,681,600    $ 47,776,040       52.1%
                  Dollar Volume Residential Real Estate Sales (3rd Qtr)    $ 219,587,006    $ 154,104,831       42.5%
                  Dollar Volume Residential Real Estate Sales (YTD)    $ 517,329,021       $ 445,640,212        16.1%
                  Hidalgo Bridge Crossings (September)                  201,861             420,809            -52.0%
                  Hidalgo Bridge Crossings (3rd Qtr)                    574,679             1,253,058          -54.1%
                  Hidalgo Bridge Crossings (YTD)                        2,295,041           3,803,068          -39.7%
                  Peso Exchange Rate (per one US dollar - September)    21.63               19.59               10.4%
                  Employment
                  Wage & Salary Employment (September)                  255,900             270,400             -5.4%
                  Wage & Salary Employment (3rd Qtr Avg)                254,765             268,000             -4.9%
                  Wage & Salary Employment (YTD Avg)                    261,165             269,365             -3.0%
                  Unemployment Rate (September)                         10.0                4.1                143.9%
                  Unemployment Rate (3rd Qtr Avg)                       9.6                 4.4                118.9%
                  Unemployment Rate (YTD Average)                       9.5                 4.2                123.3%

                  INDEX - January (Base=100 January 1996)             184.7               195.5                 -5.5%
                   *With the exception of the average monthly home sale price, all economic indicators expressed in dollar form above are adjusted for in ation by
                   restating prior periods in current dollars
                   The McAllen metro area general economy continued to su er the ravages of COVID through
              Key Points  ninth straight.  The rate of decline has slowed since the worst of the shock in April and May
                   the end of the third quarter as the McAllen Economic Index remains on the decline.  The
                   index has fallen in every month thus far in 2020, thus the September decline marks the


                   but still the index continues to fall.
                   The McAllen Economic Index declined to 184.7 in September down from 185.5 in August,
                   and down 5.5% from the September 2019 MEI of 195.5.  The index peaked at 197.6 in
                   December 2019 and is now down by 6.5% compared to that pinnacle.  The index fell at a
                   4.0% annualized rate over the course of the third quarter.
                   The mainstay local economic indicators of general spending and employment remain lower
                   compared to year-ago levels, while auto sales were sharply higher in September.  The hous-
                   ing indicators, both new construction and existing home sales, continue to perform
                   extremely well in 2020, enduring only temporary declines in April and May before a quick
                   and impressive recovery.  The travel and tourism indicators remain severely a ected though
                   both airline passenger activity and hotel/motel spending have shown some modest
                   improvement after the catastrophic COVID-related declines.
                   Employment has begun to decline again the last two months after recovering some of the
                   nearly 25,000 COVID jobs lost through April.  The seasonally adjusted estimates suggest that
                                                            -310-