Page 233 - text book form physics kssm 2020
P. 233

Chapter 5
                                                                                                  Waves
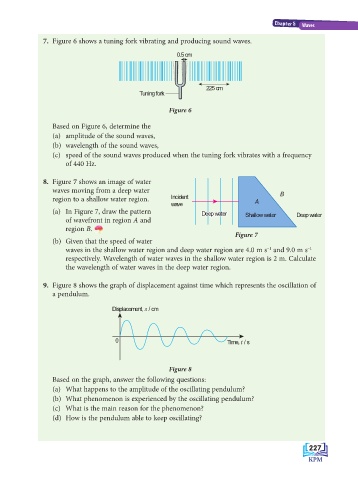
                    7.  Figure 6 shows a tuning fork vibrating and producing sound waves.
                                                            0.5 cm


                                                                     225 cm
                                                 Tuning fork


                                                          Figure 6
                       Based on Figure 6, determine the
                       (a)  amplitude of the sound waves,
                       (b)  wavelength of the sound waves,
                       (c)  speed of the sound waves produced when the tuning fork vibrates with a frequency
                           of 440 Hz.

                    8.  Figure 7 shows an image of water
                       waves moving from a deep water                                      B
                       region to a shallow water region.  Incident                 A
                                                          wave
                       (a)  In Figure 7, draw the pattern          Deep water    Shallow water  Deep water
                                                                   Deep water
                           of wavefront in region A and
                           region B.
                                                                             Figure 7
                       (b)  Given that the speed of water
                                                                                       –1
                                                                                                   –1
                           waves in the shallow water region and deep water region are 4.0 m s  and 9.0 m s
                           respectively. Wavelength of water waves in the shallow water region is 2 m. Calculate
                           the wavelength of water waves in the deep water region.
                    9.  Figure 8 shows the graph of displacement against time which represents the oscillation of
                       a pendulum.

                                         Displacement, s / cm


                                         0                                 Time, t / s


                                                          Figure 8
                       Based on the graph, answer the following questions:
                       (a)  What happens to the amplitude of the oscillating pendulum?
                       (b)  What phenomenon is experienced by the oscillating pendulum?
                       (c)  What is the main reason for the phenomenon?
                       (d)  How is the pendulum able to keep oscillating?


                                                                                                    227
                                                                                                    227
   228   229   230   231   232   233   234   235   236   237   238