
Page 80 - text book form physics kssm 2020
P. 80
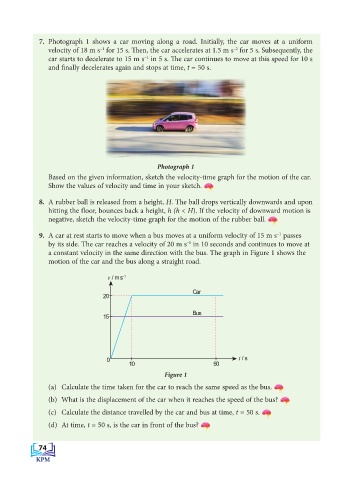
7.  Photograph 1 shows a car moving along a road. Initially, the car moves at a uniform
                                                                             –2
                     velocity of 18 m s  for 15 s. Th  en, the car accelerates at 1.5 m s  for 5 s. Subsequently, the
                                     –1
                                                  –1
                     car starts to decelerate to 15 m s  in 5 s. Th  e car continues to move at this speed for 10 s
                     and fi nally decelerates again and stops at time, t = 50 s.


                                                      Photograph 1
                     Based on the given information, sketch the velocity-time graph for the motion of the car.
                     Show the values of velocity and time in your sketch.

                  8.  A rubber ball is released from a height, H. The ball drops vertically downwards and upon
                     hitting the floor, bounces back a height, h (h < H). If the velocity of downward motion is
                     negative, sketch the velocity-time graph for the motion of the rubber ball.

                  9.  A car at rest starts to move when a bus moves at a uniform velocity of 15 m s  passes
                                                                                          –1
                                                               –1
                     by its side. The car reaches a velocity of 20 m s  in 10 seconds and continues to move at
                     a constant velocity in the same direction with the bus. The graph in Figure 1 shows the
                     motion of the car and the bus along a straight road.

                                       v / m s –1

                                                                 Car
                                      20

                                                                 Bus
                                      15


                                       0                                       t / s
                                              10                       50

                                                        Figure 1
                     (a)  Calculate the time taken for the car to reach the same speed as the bus.
                     (b)  What is the displacement of the car when it reaches the speed of the bus?
                     (c)  Calculate the distance travelled by the car and bus at time, t = 50 s.

                     (d) At time, t = 50 s, is the car in front of the bus?


                  74
                  74