
Page 37 - Forbes - USA (December 2019)
P. 37
Income meets
performance.
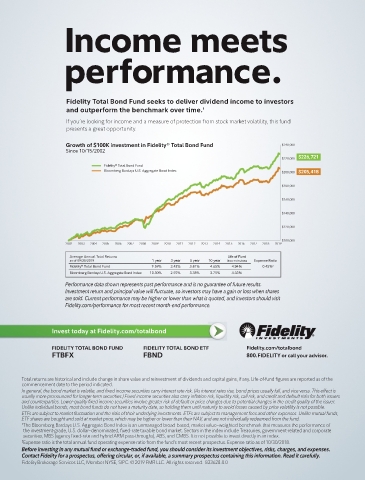
Fidelity Total Bond Fund seeks to deliver dividend income to investors
and outperform the benchmark over time. 1
If you’re looking for income and a measure of protection from stock market volatility, this fund
presents a great opportunity.
Growth of $100K investment in Fidelity® Total Bond Fund $240,000
Since 10/15/2002
$226,721
$220,000
Fidelity® Total Bond Fund
Bloomberg Barclays U.S. Aggregate Bond Index $200,000 $205,418
$180,000
$160,000
$140,000
$120,000
$100,000
2002 2003 2004 2005 2006 2007 2008 2009 2010 2011 2012 2013 2014 2015 2016 2017 2018 2019
Average Annual Total Returns Life of Fund
as of 09/30/2019 1 year 3 year 5 year 10 year Since 10/15/2002 Expense Ratio
Fidelity® Total Bond Fund 9.59% 3.42% 3.81% 4.65% 4.94% 0.45% 2
Bloomberg Barclays U.S. Aggregate Bond Index 10.30% 2.92% 3.38% 3.75% 4.33%
Performance data shown represents past performance and is no guarantee of future results.
Investment return and principal value will fluctuate, so investors may have a gain or loss when shares
are sold. Current performance may be higher or lower than what is quoted, and investors should visit
Fidelity.com/performance for most recent month-end performance.
Invest today at Fidelity.com/totalbond
FIDELITY TOTAL BOND FUND FIDELITY TOTAL BOND ETF Fidelity.com/totalbond
FTBFX FBND 800.FIDELITY or call your advisor.
Total returns are historical and include change in share value and reinvestment of dividends and capital gains, if any. Life-of-fund figures are reported as of the
commencement date to the period indicated.
In general, the bond market is volatile, and fixed income securities carry interest rate risk. (As interest rates rise, bond prices usually fall, and vice versa. This effect is
usually more pronounced for longer-term securities.) Fixed income securities also carry inflation risk, liquidity risk, call risk, and credit and default risks for both issuers
and counterparties. Lower-quality fixed income securities involve greater risk of default or price changes due to potential changes in the credit quality of the issuer.
Unlike individual bonds, most bond funds do not have a maturity date, so holding them until maturity to avoid osses caused by price volatility is not possible.
l
ETFs are subject to market fluctuation and the risks of their underlying investments. ETFs are subject to management fees and other expenses. Unlike mutual funds,
ETF shares are bought and sold at market price, which may be higher or lower than their NAV, and are not individually redeemed from the fund.
1 The Bloomberg Barclays U.S. Aggregate Bond Index is an unmanaged broad-based, market value–weighted benchmark that measures the performance of
the investment-grade, U.S. dollar–denominated, fixed-rate taxable bond market. Sectors in the index include Treasuries, government-related and corporate
securities, MBS (agency fixed-rate and hybrid ARM pass-throughs), ABS, and CMBS. It is not possible to nvest directly in an index.
i
2 Expense ratio is the total annual fund operating expense ratio from the fund’s most recent prospectus. Expense ratio as of 10/30/2018.
Before investing in any mutual fund or exchange-traded fund, you should consider its investment objectives, risks, charges, and expenses.
Contact Fidelity for a prospectus, offering circular, or, if available, a summary prospectus containing this information. Read it carefully.
Fidelity Brokerage Services LLC, Member NYSE, SIPC. © 2019 FMR LLC. All rights reserved. 833628.8.0