
Page 74 - ANC22-Presentations-Weds
P. 74
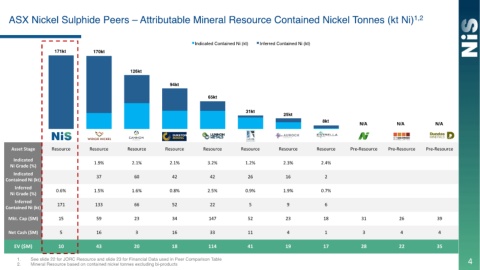
ASX Nickel Sulphide Peers – Attributable Mineral Resource Contained Nickel Tonnes (kt Ni)                                                                          1,2


                                                                               Indicated Contained Ni (kt)  Inferred Contained Ni (kt)
                       171kt          170kt


                                                     126kt


                                                                     94kt

                                                                                    65kt

                                                                                                   31kt
                                                                                                                  25kt
                                                                                                                                  8kt
                                                                                                                                                 N/A            N/A            N/A

                        NIS	           WIN	           CNR	           DKM	            LM8	           AZS	           AOU	           ESR	                          NIM	            SGQ
     Asset	Stage	     Resource	      Resource	      Resource	      Resource	      Resource	      Resource	       Resource	      Resource	    Pre-Resource		  Pre-Resource		  Pre-Resource

      Indicated
     Ni	Grade	(%)	                     1.9%	          2.1%	          2.1%	          3.2%	          1.2%	          2.3%	           2.4%
      Indicated
   Contained	Ni	(kt)	                   37	            60	            42	            42	            26	            16	             2
       Inferred
     Ni	Grade	(%)	     0.6%	           1.5%	          1.6%	          0.8%	          2.5%	          0.9%	          1.9%	           0.7%
       Inferred		       171	           133	            66	            52	            22	             5	             9	             6
   Contained	Ni	(kt)

    Mkt.	Cap	($M)	      15	             59	            23	            34	           147	            52	            23	            18	             31	            26	            39

    Net	Cash	($M)	       5	             16	            3	             16	            33	            11	             4	             1	             3	             4	             4


       EV	($M)	         10	            43	             20	            18	           114	            41	            19	            17	             28	            22	            35

        1.   See slide 22 for JORC Resource and slide 23 for Financial Data used in Peer Comparison Table                                                                                   4
        2.   Mineral Resource based on contained nickel tonnes excluding bi-products