
Page 311 - ANC-Presentations-Full-18-10_Neat
P. 311
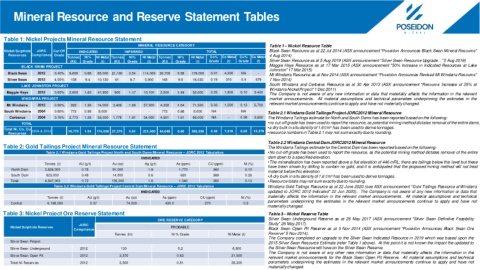
Mineral Resource and Reserve Statement Tables


  Table 1: Nickel Projects Mineral Resource Statement
                                                        MINERAL  RESOURCE CATEGORY                           Table 1 – Nickel Resource Table
   Nickel Sulphide   JORC   Cut Off   INDICATED    INFERRED                         TOTAL                    Black Swan Resource as at 22 Jul 2014 (ASX announcement “Poseidon Announces Black Swan Mineral Resource”
    Resources  Compliance Grade                                                                              4 Aug 2014)
                            Tonnes    Ni%   Ni Metal   Tonnes    Ni%   Ni Metal   Tonnes       Ni%   Ni Metal     Co%  Co Metal  Cu%  Cu Metal
                             (Kt)  Grade  (t)  (Kt)  Grade  (t)   (Kt)  Grade  (t)   Grade  (t)  Grade  (t)  Silver Swan Resource as at 5 Aug 2019 (ASX announcement “Silver Swan Resource Upgrade…”5 Aug 2019)
          BLACK SWAN  PROJECT                                                                                Maggie Hays Resource as at 17 Mar 2015 (ASX announcement “50% Increase in Indicated Resources at Lake
                                                                                                             Johnston”17 Mar 2015)
    Black Swan  2012   0.40%  9,600  0.68  65,000  21,100  0.54  114,000  30,700  0.58  179,000  0.01  4,200  NA  -  Mt Windarra Resource as at Nov 2014 (ASX announcement “Poseidon Announces Revised Mt Windarra Resource”
    Silver Swan  2012  4.50%  108  9.4  10,130  61   9.7   5,900  168   9.5   16,030  0.19  316   0.4  679   7 Nov 2014)
          LAKE  JOHNSTON PROJECT                                                                             South Windarra and Cerberus Resource as at 30 Apr 2013 (ASX announcement “Resource Increase of 25% at
                                                                                                             Windarra NickelProject”1 Dec 2011)
    Maggie Hays  2012  0.80%  2,600  1.60  41,900  900  1.17  10,100  3,500  1.49  52,000  0.05  1,800  0.10  3,400  The Company is not aware of any new information or data that materially affects the information in the relevant
          WINDARRA  PROJECT                                                                                  market announcements. All material assumptions and technical parameters underpinning the estimates in the
    Mt  Windarra  2012  0.90%  922  1.56  14,000  3,436  1.66  57,500  4,358  1.64  71,500  0.03  1,200  0.13  5,700  relevant market announcements continue to apply and have not materiallychanged.
   South Windarra  2004  0.80%  772  0.98  8,000  -   -     -     772   0.98  8,000   NA    -     NA    -   Table 2.1 Windarra Gold Tailings Project JORC2012 Mineral Resource
     Cerberus   2004   0.75%  2,773  1.25  35,000  1,778  1.91  34,000  4,551  1.51  69,000  NA  -  0.08  3,600  The Windarra Tailings estimate for North and South Dams has been reported based on the following:
          TOTAL                                                                                             •no cut-off grade has been used to report the resource, as potential mining method dictates removal of the entire dams.
                                                                                                            •a dry bulk in situ density of 1.6 t/m has been used to derive tonnages.
                                                                                                                                     3
   Total Ni, Co, Cu  2004 & 2012  16,775  1.04  174,030 27,275  0.81  221,500  44,049  0.90  395,530  0.02  7,516  0.03  13,379
    Resources                                                                                               •resource numbers in Table 2.1 may not sum exactly due to rounding.
                                                                                                            Table 2.2 Windarra Central DamJORC2012 Mineral Resource
  Table 2: Gold Tailings Project Mineral Resource Statement                                                 The Windarra Tailings estimate for the Central Dam has been reported based on the following:
                   Table 2.1 Windarra Gold Tailings Project North and South Dams Mineral Resource – JORC 2012  Tabulation  •No cut-off grade has been used to report the resource, as the potential mining method dictates removal of the entire
                                                         INDICATED                                          dam down to a specified elevation.
                   Tonnes (t)    AU (g/t)     Au (oz)      Ag (g/t)     As (ppm)    CU (ppm)       Ni (%)   •The mineralisation has been reported above a flat elevation of 446 mRL; there are tailings below this level but these
                                                                                                            have been shown by drilling to contain no gold, and it is anticipated that the proposed mining method will not treat
      North Dam    3,624,000      0.78        91,000        1.9          1,770        360          0.10
                                                                                                            material belowthis elevation.
     South Dam     923,000        0.48        14,000        0.6          630          369          0.26     •A dry bulk in situ densityof 1.6 t/m has been used to derive tonnages.
                                                                                                                                     3
     Total         4,547,000      0.72        105,000       1.6          1,540        360          0.13     •Resource totals maynot sum exactlydue to rounding.
                      Table 2.2 Windarra Gold Tailings Project Central Dam Mineral Resource – JORC 2012 Tabulation  Windarra Gold Tailings Resource as at 22 June 2020 (see ASX announcement “Gold Tailings Resource at Windarra
                                                         INDICATED                                          updated to JORC 2012 Indicated” 22 Jun 2020). The Company is not aware of any new information or data that
                    Tonnes (t)      AU (g/t)       Au (oz)        As (ppm)       CU (ppm)        Ni (%)     materially affects the information in the relevant market announcements. All material assumptions and technical
                                                                                                            parameters underpinning the estimates in the relevant market announcements continue to apply and have not
     Central        6,198,000        0.37           74,000         435.0           270            0.3
                                                                                                            materiallychanged.
  Table 3: Nickel Project Ore Reserve Statement                                                             Table 3 – Nickel Reserve Table
                                                                ORE RESERVE CATEGORY                        Silver Swan Underground Reserve as at 26 May 2017 (ASX announcement “Silver Swan Definitive Feasibility
                                 JORC                                                                       Study” 26 May 2017).
     Nickel Sulphide Reserves                                        PROBABLE
                              Compliance                                                                    Black Swan Open Pit Reserve as at 5 Nov 2014 (ASX announcement “Poseidon Announces Black Swan Ore
                                               Tonnes  (kt)           Ni % Grade            Ni Metal  (t)   Reserve”5 Nov 2014).
                                                                                                            The Company completed an upgrade to the Silver Swan Indicated Resource in 2019 which was based upon the
     Silv er Swan  Project                                                                                  2015 Silver Swan Resource Estimate (refer Table 1 above). At this point it is not known the impact the updated to
     Silv er Swan  Underground   2012            130                    5.2                   6,800         the Silver Swan Resource will have on the Silver Swan Reserve.
                                                                                                            The Company is not aware of any other new information or data that materially affects the information in the
     Silv er Swan  Open Pit      2012            3,370                  0.63                  21,500        relevant market announcements for the Black Swan Open Pit Reserve. All material assumptions and technical
     Total Ni Reserv es          2012            3,500                  0.81                  28,300        parameters underpinning the estimates in the relevant market announcements continue to apply and have not
                                                                                                            materiallychanged.