Page 448 - ANC-Presentations-Full-18-10_Neat
P. 448

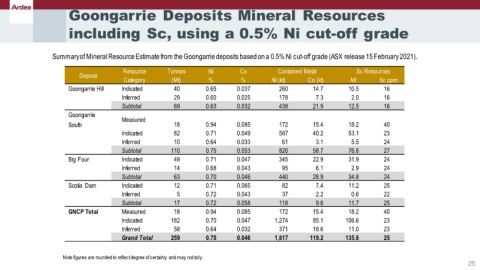
Goongarrie Deposits Mineral Resources

                      including Sc, using a 0.5% Ni cut-off grade


                 Summary of Mineral Resource Estimate from the Goongarrie deposits based on a 0.5% Ni cut-off grade (ASX release 15 February 2021).

                                      Resource     Tonnes       Ni       Co         Contained Metal         Sc Resources
                         Deposit
                                      Category      (Mt)        %        %         Ni (kt)   Co (kt)      Mt       Sc ppm
                     Goongarrie Hill  Indicated      40        0.65     0.037        260       14.7       10.5      16
                                     Inferred        29        0.60     0.025        178        7.3       2.0       16
                                     Subtotal        69        0.63     0.032        438       21.9       12.5      16
                     Goongarrie      Measured
                     South                           18        0.94     0.085        172       15.4       18.2      40
                                     Indicated       82        0.71     0.049        587       40.2       53.1      23
                                     Inferred        10        0.64     0.033         61        3.1       5.5       24
                                     Subtotal       110        0.75     0.053        820       58.7       76.8      27
                     Big Four        Indicated       49        0.71     0.047        345       22.9       31.9      24
                                     Inferred        14        0.68     0.043         95        6.1       2.9       24
                                     Subtotal        63        0.70     0.046        440       28.9       34.8      24
                     Scotia  Dam     Indicated       12        0.71     0.065         82        7.4       11.2      25
                                     Inferred         5        0.72     0.043         37        2.2       0.6       22
                                     Subtotal        17        0.72     0.058        118        9.6       11.7      25
                     GNCP Total      Measured        18        0.94     0.085        172       15.4       18.2      40
                                     Indicated      182        0.70     0.047      1,274       85.1      106.6      23
                                     Inferred        58        0.64     0.032        371       18.6       11.0      23
                                     Grand Total    259        0.70     0.046      1,817      119.2      135.8      25


                    Note figures are rounded to reflect degree of certainty and may not tally.
                                                                                                                                              25
   443   444   445   446   447   448   449   450   451   452   453