
Page 72 - ANC20-Proceedings-Presentations-Full
P. 72
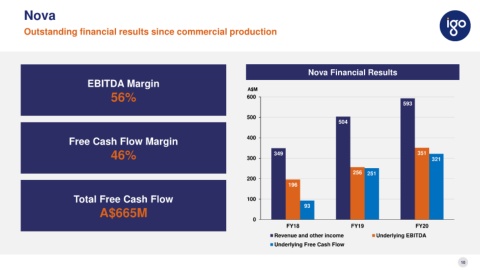
Nova


            Outstanding financial results since commercial production


                                                                                                                                         Nova Financial Results

                                       EBITDA Margin
                                                                                                              A$M
                                                  56%                                                         600

                                                                                                                                                                                   593


                                                                                                              500
                                                                                                                                                      504


                               Free Cash Flow Margin                                                          400


                                                  46%                                                         300         349                                                            351   321


                                                                                                                                                             256   251
                                                                                                              200
                                                                                                                                196

                                 Total Free Cash Flow                                                         100

                                                                                                                                       93
                                             A$665M

                                                                                                                 0
                                                                                                                               FY18                         FY19                        FY20
                                                                                                                          Revenue and other income                     Underlying EBITDA

                                                                                                                          Underlying Free Cash Flow


                                                                                                                                                                                                            10