
Page 44 - ATR 5 2012 web 2
P. 44
S TaT v I E w
PART 2: FREIGHT TRANSPORTATION IN 2009 |20
exaggerated than they initially appeared. Although the then contracted by 6.9% in 2009. We expect GDP growth
deterioration in domestic security has damaged business to average 3.7% per year in 2010-2015 and 4.2% annually
GDP, Holiday Retail Sales Continue Slow Climb
and consumer confidence, its impact on macroeconomic from 2016-2021.
aggregates is still limited. Economic growth in Mexico
Core retail sales gained 0.9 percent in
Kipling, the Washington, D.C.-based
for holiday sales are improved consumer
continues to follow the U.S. business cycle closely. Industrial Production: Mexican industrial output grew
confidence in September, rising home val-
economic forecaster says real GDP growth
September alone; suggesting that overall
Nevertheless, escalating violence presents a major risk 3.7% in 2004, 2.8% in 2005, 5.7% in 2006, and 2.5% in
of about 2 percent this year is the best to
factor for long-term growth. third-quarter consumer spending was ues and expanding consumer credit mak-
2007, before declining 0.7% in 2008 and a whopping
expect, with more of the same in 2013. stronger than the 1.5 percent growth of ing up for slow income growth. Holiday
7.3% in 2009. Our current forecast puts industrial-sector
Core retail sales will continue to be
Summarizing the Outlook: the second quarter, contributing strongly sales will get a lift from growing demand
growth at 4.7% per year in 2010-2015 and 4.1% per year
strong through the rest of 2012 before
for sporting goods, apparel and discounted
to GDP growth.
during 2016-2021.
falling off in the first quarter of 2013. Encouraging retailers’ expectations items.
GDP: The Mexican economy expanded at a healthy 4.0%
clip in 2004, 3.2% in 2005, 5.1% in 2006 and 3.3% in 2007,
before growth slowed to 1.4% in 2008 and the economy
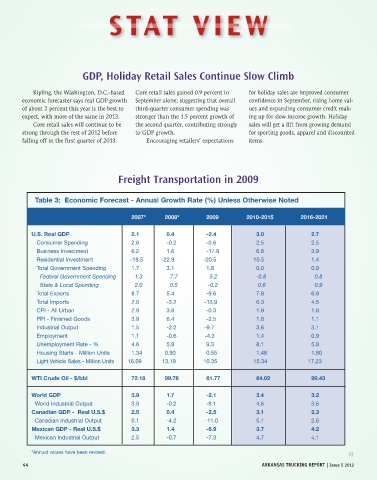
Freight Transportation in 2009
Table 3: Economic Forecast - Annual Growth Rate (%) Unless Otherwise Noted
2007* 2008* 2009 2010-2015 2016-2021
U.S. Real GDP 2.1 0.4 -2.4 3.0 2.7
Consumer Spending 2.6 -0.2 -0.6 2.5 2.5
Business Investment 6.2 1.6 -17.8 6.8 3.9
Residential Investment -18.5 -22.9 -20.5 10.5 1.4
Total Government Spending 1.7 3.1 1.8 0.0 0.9
Federal Government Spending 1.3 7.7 5.2 -0.8 0.8
State & Local Spending 2.0 0.5 -0.2 0.6 0.9
Total Exports 8.7 5.4 -9.6 7.8 6.9
Total Imports 2.0 -3.2 -13.9 6.3 4.5
CPI - All Urban 2.9 3.8 -0.3 1.9 1.8
PPI - Finished Goods 3.9 6.4 -2.5 1.8 1.1
Industrial Output 1.5 -2.2 -9.7 3.6 3.1
Employment 1.1 -0.6 -4.3 1.4 0.9
Unemployment Rate - % 4.6 5.8 9.3 8.1 5.8
Housing Starts - Million Units 1.34 0.90 0.55 1.48 1.80
Light Vehicle Sales - Million Units 16.09 13.19 10.35 15.34 17.23
WTI Crude Oil - $/bbl 72.18 99.76 61.77 84.02 99.43
World GDP 3.9 1.7 -2.1 3.4 3.2
World Industrial Output 3.9 -0.2 -9.1 4.6 3.6
Canadian GDP - Real U.S.$ 2.5 0.4 -2.5 3.1 2.3
Canadian Industrial Output 0.1 -4.2 -11.0 5.1 2.6
Mexican GDP - Real U.S.$ 3.3 1.4 -6.9 3.7 4.2
Mexican Industrial Output 2.5 -0.7 -7.3 4.7 4.1
*Annual values have been revised.
44 arkansas truCking rePort | issue 5 2012