
Page 48 - ATR 3 2012 web 2
P. 48
S TaT v I E W
Trends_2012_Layout13/29/124:30PMPage15
AMERICAN TRUCKING TRENDS 2012 | 15
Revenue per Mile and Revenue per Ton
Revenue per Mile and Revenue per Ton:
index has recovered to just below 2008’s record 147.0.
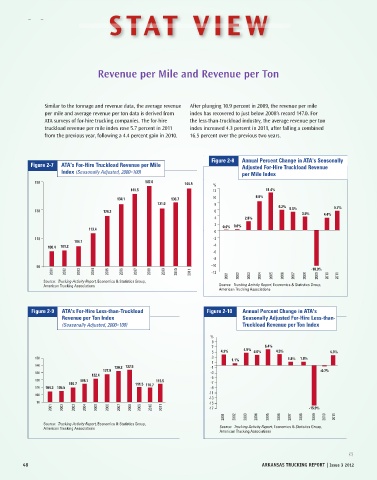
Similar to the tonnage and revenue data, the average After plunging 10.9 percent in 2009, the revenue per mile
Similar to the tonnage and revenue data, the average revenue
revenue per mile and average revenue per ton data is index has recovered to just below 2008’s record 147.0. For
For the less-than-truckload industry, the average
per mile and average revenue per ton data is derived from
derived from ATA surveys of for-hire trucking companies. the less-than-truckload industry, the average revenue per
ATA surveys of for-hire trucking companies. The for-hire
revenue per ton index increased 4.3% in 2011, afterton
falling a combined 16.5% over the previous two years.
The for-hire truckload revenue per mile index rose 5.7% index increased 4.3 percent in 2011, after falling a combined
truckload revenue per mile index rose 5.7 percent in 2011
in 2011 from the previous year, following a 4.4% gain in 16.5 percent over the previous two years.
from the previous year, following a 4.4 percent gain in 2010.
2010. After plunging 10.9% in 2009, the revenue per mile
Figure 2-8 Annual Percent Change in ATA's Seasonally
Figure 2-7 ATA's For-Hire Truckload Revenue per Mile Adjusted For-Hire Truckload Revenue
Index (Seasonally Adjusted, 2000=100) per Mile Index
150 147.0 144.5 %
141.5 12 11.4%
134.1 136.7 10 8.9%
131.0 8
6.2% 5.5% 5.7%
130 126.3 6 3.9% 4.4%
4 2.8%
2 0.4% 0.8%
113.4
0
110 -2
104.1
100.4 101.2 -4
-6
-8
90 -10 -10.9%
2001 2002 2003 2004 2005 2006 2007 2008 2009 2010 2011 -12 2010 2011
Source: Trucking Activity Report, Economics & Statistics Group, 2001 2002 2003 2004 2005 2006 2007 2008 2009
American Trucking Associations Source: Trucking Activity Report, Economics & Statistics Group,
American Trucking Associations
Figure 2-9 ATA's For-Hire Less-than-Truckload Figure 2-10 Annual Percent Change in ATA's
Revenue per Ton Index Seasonally Adjusted For-Hire Less-than-
(Seasonally Adjusted, 2000=100) Truckload Revenue per Ton Index
%
9
7 4.9% 6.4%
5 4.3% 4.0% 4.5% 4.3%
150 3 1.1% 1.8% 1.8%
1
140 130.2 132.5 -1
127.9 -0.7%
130 -3
122.4
120 115.1 115.5 -5
110.7 111.5 110.7 -7
110 104.3 105.5 -9
-11
100
-13
90 -15
2001 2002 2003 2004 2005 2006 2007 2008 2009 2010 2011 -17 -15.9%
2001 2002 2003 2004 2005 2006 2007 2008 2009 2010 2011
Source: Trucking Activity Report, Economics & Statistics Group,
American Trucking Associations Source: Trucking Activity Report, Economics & Statistics Group,
American Trucking Associations
48 aRkansas TRucking RePoRT | issue 3 2012