Page 9 - Grab Me SPM Add Mathematics Form 4,5
P. 9

©PAN ASIA PUBLICATIONS
           Example 8                              6.3  Application of Linear Law
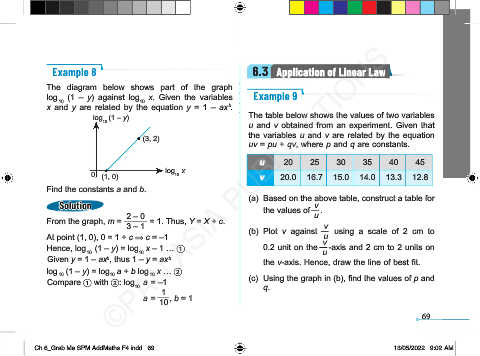
          The  diagram  below  shows  part  of  the  graph
          log   (1  –  y)  against  log   x.  Given  the  variables   Example 9
            10
                            10
          x  and  y  are  related  by  the  equation  y  =  1  –  ax .
                                             b
                   log (1 – y)                   The table below shows the values of two variables
                     10
                                                 u and v obtained from an experiment. Given that
                            (3, 2)               the variables u and v are related by the equation
                                                 uv = pu + qv, where p and q are constants.
                                                   u    20   25   30   35   40   45
                                 log  x
                   0  (1, 0)       10              v   20.0  16.7  15.0  14.0  13.3  12.8
          Find the constants a and b.
                                                 (a)  Based on the above table, construct a table for
            Solution                                the values of  .
                                                              v
                         2 – 0                                u
          From the graph, m =    = 1. Thus, Y = X + c.
                         3 – 1                                 v
          At point (1, 0), 0 = 1 + c Ú c = –1    (b)  Plot  v  against   v u    using  a  scale  of  2  cm  to
          Hence, log  (1 – y) = log  x – 1 …       0.2 unit on the   u  -axis and 2 cm to 2 units on
                  10
                            10
          Given y = 1 – ax , thus 1 – y = ax b      the v-axis. Hence, draw the line of best fit.
                      b
          log  (1 – y) = log  a + b log  x … 
                      10
            10
                              10
          Compare  with : log  a = –1          (c)  Using the graph in (b), find the values of p and
                           10                       q.
                             a =   1  , b = 1
                                10
                                                                                  69
        Ch 6_Grab Me SPM AddMaths F4.indd   69                               13/05/2022   9:02 AM
   4   5   6   7   8   9   10   11   12   13   14