Page 17 - 1202 Question Bank Mathematics Form 4
P. 17

Section B
                                                          [45 marks]
                                              Answer all the questions in this section.

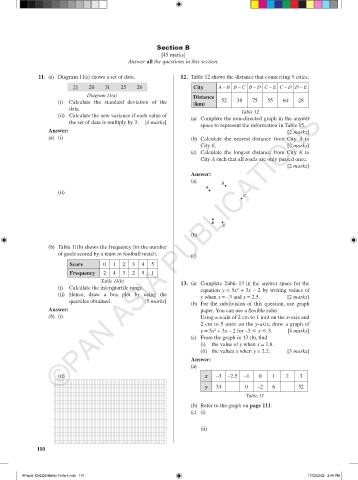
               11.  (a)  Diagram 11(a) shows a set of data.       12.  Table 12 shows the distance that connecting 5 cities.

                           21    20   31    25    26                  City    A – B B – C B – D C – E C – D D – E
                                Diagram 11(a)                         Distance
                      (i)  Calculate the standard deviation of the    (km)      52   38   75    55   60    28
                          data.
                                                                                       Table 12
                      ©PAN ASIA PUBLICATIONS
                      (ii)  Calculate the new variance if each value of   (a)  Complete the non-directed graph in the answer
                          the set of data is multiply by 3.  [4 marks]
                                                                        space to represent the information in Table 15.
                  Answer:                                                                              [2  marks]
                  (a)  (i)                                           (b)  Calculate the nearest distance from City  A to
                                                                        City E.                        [2 marks]
                                                                     (c)  Calculate the longest distance from City  E to
                                                                        City A such that all roads are only passed once.
                                                                                                       [2  marks]
                                                                     Answer:
                                                                     (a)
                                                                               B
                                                                          A
                      (ii)
                                                                                       C


                                                                            E
                                                                                D
                                                                     (b)
                  (b)  Table 11(b) shows the frequency for the number
                      of goals scored by a team in football match.   (c)

                          Score       0  1  2   3  4   5
                          Frequency   2  4  3   2  5   1
                                     Table 11(b)                  13.  (a)  Complete Table 13 in the answer space for the
                      (i)  Calculate the interquartile range.           equation y = 5x  + 3x – 2 by writing values of
                                                                                     2
                      (ii)  Hence, draw  a box plot by using the        y when x = –3 and x = 2.5.     [2 marks]
                          quartiles obtained.       [5 marks]
                                                                     (b)  For the subdivision of this question, use graph
                  Answer:                                               paper. You can use a flexible ruler.
                  (b)  (i)                                              Using a scale of 2 cm to 1 unit on the x-axis and
                                                                        2 cm to 5 units on the y-axis, draw a graph of
                                                                             2
                                                                        y = 5x  + 3x – 2 for –3 < x < 3.   [4 marks]
                                                                     (c)  From the graph in 13 (b), find
                                                                        (i)  the value of y when x = 1.8.
                                                                        (ii)  the values x when y = 2.2.   [3 marks]
                                                                     Answer:
                                                                     (a)

                      (ii)                                                x   –3  –2.5  –1   0    1   2    3
                                                                          y   34        0   –2    6        52
                                                                                        Table 13
                                                                     (b)  Refer to the graph on page 111.
                                                                     (c)  (i)

                                                                        (ii)


              110


         APaper 1202QB Maths Form 4.indd   110                                                                17/02/2022   2:49 PM
   12   13   14   15   16   17   18   19   20   21