
Page 204 - Microsoft Word - Bogra-01-Community-11
P. 204
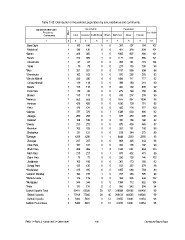
Table C-02: Distribution of household, population by sex, residence and community

              Administrative Unit  RMO                    Households                              Population   Sex Ratio
                      Residence                       General Institutional Others  Both Sex Male Female
                        Community              Total

                          1        23                 4  5       6                    7         8       9      10

 Bara Dighi                        1 100 100                  0     0                   381      197      184    107
 Madaimuri                                                    0     0                   487      248      239    104
*Barahi                            1 136 136                  1     0                 1805       907      898    101
 Barahi                                                       1     0                 1177       591      586    101
 Chenchuria                        1 486 485                  0     0                   355      181      174    104
 Yanla                                                        0     0                   273      135      138     98
*Bisa                              1 310 309                  0     0                 1197       559      638     88
*Chenchuria                        1 97 97                    0     0                   550      265      285     93
*Chhota Nilahali                                              0     0                 1494       717      777     92
 Chhota Nilahali                   1 79 79                    0     0                   399      189      210     90
 Barahi                                                       0     0                   400      192      208     92
 Pora Para                         1 321 321                  0     0                   279      129      150     86
 Bhebra                                                       0     0                   416      207      209     99
*Herenza                           1 162 162                  0     0                 1975       967    1008      96
 Herenza                                                      0     0                 1520       739      781     95
 Parla                             1 435 435                  0     0                   455      228      227    100
*Jalanga                                                      0     1                 1328       638      690     92
 Jalanga                           1 119 119                  0     1                   978      480      498     96
 Kalaikuri                                                    0     0                   350      158      192     82
*Jhenay                            1 118 118                  0     0                   870      405      465     87
 Kasiakuri                                                    0     0                   351      161      190     85
 Shaharkuri                        1 80 80                    0     0                   519      244      275     89
*Zianagar                          1 118 118                  1     1                 4648     2263     2385      95
 Zianagar                                                     0     0                   868      425      443     96
 Chak Para                         1 552 552                  0     0                   392      195      197     99
 Khidir Para                                                  1     0                 1344       681      663    103
 Miah Para                         1 426 426                  0     1                   875      402      473     85
 Dighir Para                                                  0     0                   295      150      145    103
 Jhalgharia                        1 126 126                  0     0                   361      173      188     92
 Sohagi Para                                                  0     0                   513      237      276     86
*Khalishwar                        1 377 376                  0     0                 1455       686      769     89
*Lakshmi Mandap                                               1     0                   781      386      395     98
*Mahishmunda                       1 269 268                  0     0                   468      236      232    102
*Murtajapur                                                   0     0                 1394       712      682    104
*Polla                             1 108 108                  0     0                   500      242      258     94
Gabtali Upazila Total                                        28   57                319588   159186   160402      99
 Gabtali Upazila                   1 233 233                 28   45                298133   148585   149548      99
 Gabtali Upazila                   1 102 102                  0   12                 21455    10601    10854      98
Gabtali Paurashava                                            0   12                 21455    10601    10854      98
                                   1 131 131

                                   1 1238 1236

                                   1 247 247

                                   1 107 107
                                   1 353 352

                                   1 218 217

                                   1 73 73
                                   1 105 105

                                   1 135 135

                                   1 415 415

                                   1 194 193

                                   1 142 142
                                   1 344 344

                                   1 131 131

                                         83411 83326
                                   1 77918 77845

                                   2 5493 5481

                                   2 5493 5481

RMO: 1 = Rural, 2 = Urban and 3 = Other Urban            186                                                  Community Report: Bogra