
Page 821 - Microsoft Word - Bogra-01-Community-11
P. 821
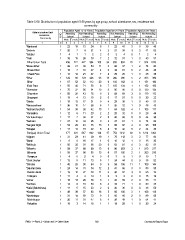
Table C-08: Distribution of population aged 15-29 years by age group, school attendance, sex, residence and
                                                         community

        Administrative Unit        Population Aged 15-19 Years Population Aged 20-24 Years Population Aged 25-29 Years
                 Residence
                   Community  RMO  Attending Not Attending Attending Not Attending Attending Not Attending

                     1             School      School  School  School  School  School

*Ramkandi                          Male Female Male Female Male Female Male Female Male Female Male Female
*Saduria
*Saidpur                      2 3 4 5 6 7 8 9 10 11 12 13 14
*Teail
 Bihar Union Total            1 22 15 13 24 6 1 22 41 3 0 39 49
*Bhasu Bihar
 Bhasu Bihar                  1 20 7 8 21 4 2 21 39 3 2 41 52
 Chand Para
*Bihar                        1 411220240124
 Bihar
 Fakir Para                   1 36 15 26 30 7 2 32 51 1 0 43 57
*Dhamahar
 Dhamahar                          456 277 427 584 108 34 659 984 20 7 974 1076
 Singargari
*Dobila                       1 29 21 39 54 11 2 68 87 1 2 74 82
*Narayanshwar
*Natmaricha (Part)            1 16 7 18 27 4 0 39 61 0 2 46 46
*Panaratika
*Par Lakshmipur               1 13 14 21 27 7 2 29 26 1 0 28 36
*Sachiani
*Sangsar Dighi                1 122 92 123 205 28 13 205 296 5 2 303 330
*Solagari
 Buriganj Union Total         1 67 52 52 112 20 6 102 162 4 1 151 180
*Aligram
*Barail                       1 55 40 71 93 8 7 103 134 1 1 152 150
*Belbhuja
*Bilhamla                     1 70 32 56 91 10 3 85 90 3 0 130 134
 Bilhamla
 Sonapura                     1 55 28 43 76 8 3 68 69 3 0 110 112
*Chak Jinahar
*Chhatra                      1 15 4 13 15 2 0 17 21 0 0 20 22
*Dakshin Belai
 Dakshin Belai                1 18 13 17 31 9 4 28 36 1 0 40 51
 Tetulgara
*Jamur                        1 36 18 17 28 6 1 26 32 1 0 46 49
*Kamtara
*Katlal (Balukchara)          1 54 34 38 42 13 1 64 122 4 1 105 117
*Khadail
*Nischintapur                 1 12 6 11 20 2 2 20 32 0 0 29 46
 Nischintapur
 Paligatha                    1 17 7 34 31 2 0 40 69 0 0 44 38

                              1 27 12 33 25 9 3 47 81 1 0 74 83

                              1 54 29 43 35 13 3 60 97 4 0 95 106

                              1 17 13 16 22 5 2 16 42 0 2 34 40

                                   477 291 567 692 139 47 753 1242 39 8 1213 1363

                              1 31 23 41 39 19 1 70 112 3 2 77 94

                              1 6 0 16 17 1 0 10 12 1 0 15 30

                              1 50 35 31 36 20 9 63 81 4 3 82 91

                              1 59 37 88 89 13 6 90 203 3 1 213 217

                              1 55 37 86 85 13 6 87 195 2 1 203 210

                              1 4 0 2 4 0 0 3 8 1 0 10 7

                              1 12 5 11 13 5 1 24 44 0 0 35 52

                              1 48 25 50 64 9 9 59 106 11 1 109 144

                              1 24 14 31 54 12 2 41 66 3 0 80 88

                              1 13 10 27 40 11 2 36 57 3 0 65 72

                              1 11 4 4 14 1 0 5 9 0 0 15 16

                              1 16 13 29 36 3 1 43 59 2 0 53 71

                              1 14 8 19 33 8 4 34 71 1 0 59 32

                              1 11 5 15 23 2 0 26 38 0 0 38 59

                              1 49 39 57 68 16 5 66 100 3 1 108 118

                              1 31 14 59 73 9 5 60 95 2 0 89 88

                              1 20 11 31 47 8 4 39 49 1 0 54 47

                              1 10 3 14 18 1 1 19 29 1 0 20 24

RMO: 1 = Rural, 2 = Urban and 3 = Other Urban          803                     Community Report: Bogra